
Deskripsi
Trend Pullback Profiler
Trend Pullback Profiler adalah indikator cTrader yang dibuat untuk menganalisis bagaimana sebuah tren bernafas dengan mengukur kedalaman dan frekuensi pullback – sekarang juga dalam persentase retracement Fibonacci.
Menggunakan filter tren berbasis EMA, indikator ini:
- mendeteksi kapan uptrend atau downtrend yang jelas sedang berlangsung;
- mengidentifikasi setiap pullback yang terkonfirmasi dalam tren tersebut;
- mengukur kedalaman pullback dalam pips;
- menghitung persentase retracement gaya Fibonacci relatif terhadap kaki impuls terakhir;
- melacak secara langsung:
-
- berapa banyak pullback yang terjadi dalam tren saat ini,
- kedalaman pullback terakhir,
- kedalaman pullback rata-rata,
- persentase retracement Fibonacci terakhir.
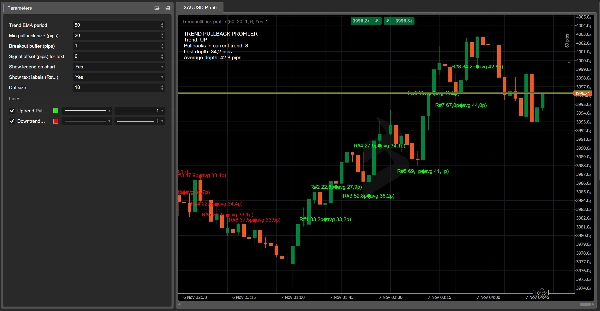
Di grafik, indikator ini:
- menggambar titik hijau besar pada titik terendah pullback dalam uptrend,
- titik merah besar pada titik tertinggi pullback dalam downtrend,
- opsional mencetak label ringkas seperti:
22.5 p / 38.2%.
Di sudut kiri atas, legenda dinamis menampilkan:
- arah tren saat ini (NAIK / TURUN / TIDAK ADA);
- jumlah pullback dalam tren saat ini;
- kedalaman pullback terakhir (dalam pips);
- kedalaman pullback rata-rata (dalam pips);
- persentase retracement Fibonacci terakhir.
Parameter Kunci
- Periode EMA Tren
Periode EMA yang digunakan untuk menentukan arah tren. - Ukuran pullback minimum (pips)
Kedalaman pullback minimum yang diperlukan (dalam pips) untuk dihitung sebagai retracement yang valid. - Buffer breakout (pips)
Jarak ekstra yang harus ditempuh harga melewati ekstrem tren sebelumnya untuk mengonfirmasi kaki baru dan menutup pullback. - Offset sinyal (pips) untuk teks
Offset vertikal untuk label teks relatif terhadap titik tinggi/rendah pullback. - Tampilkan legenda di grafik
Mengaktifkan atau menonaktifkan legenda di grafik dengan metrik tren, terakhir, dan rata-rata. - Tampilkan label teks di dekat titik
Jika diaktifkan, mencetak label kecil di samping titik dengan kedalaman pullback (dan opsional persentase Fibonacci). - Tampilkan % Fibonacci dalam label
Jika diaktifkan, menampilkan pips dan % Fibonacci dalam label (XX.Xp / YY.Y%). - Ukuran titik
Mengontrol seberapa besar titik-titik muncul di grafik, membuat pullback mudah dikenali bahkan pada timeframe yang lebih rendah.
Kasus penggunaan praktis
- Memprofilkan secara visual seberapa dalam pullback biasanya pada simbol/timeframe tertentu.
- Merencanakan entri limit di sekitar zona retracement tipikal daripada level acak.
- Mendeteksi pullback yang sangat dalam (misalnya, melewati 61.8% atau 78.6%) yang mungkin menandakan kelelahan tren atau kemungkinan pembalikan.
- Menambahkan informasi pullback dan Fibonacci yang objektif dan numerik ke dalam buku strategi trading tren Anda.
Cara perhitungan retracement Fibonacci di Trend Pullback Profiler
Trend Pullback Profiler menghitung persentase retracement gaya Fibonacci berdasarkan kaki impuls terakhir dari tren, bukan pada titik tertinggi dan terendah sembarangan.
Dalam uptrend
- Indikator melacak kaki impuls dari:
-
- Harga dasar tren = titik rendah signifikan terakhir (akhir pullback sebelumnya)
- Ekstrem tren = titik tinggi ayunan terakhir dari tren
- Saat pullback terbentuk, indikator mengukur:
-
- Kedalaman pullback (harga):
depthPrice = trendHigh – pullbackLow - Ukuran kaki impuls:
legSize = trendHigh – trendBasePrice
- Kedalaman pullback (harga):
- Persentase retracement Fibonacci adalah:
Fib% = (depthPrice / legSize) * 100
Jadi jika harga mundur sekitar 38.2%–50% dari impuls terakhir sebelum melanjutkan naik, Anda akan melihat nilai mendekati 38.2%, 50%, 61.8%, dan seterusnya.
Dalam downtrend
- Kaki impuls berjalan dari:
-
- Harga dasar tren = titik tinggi signifikan terakhir (akhir pullback sebelumnya)
- Ekstrem tren = titik rendah ayunan terakhir dari tren
- Pullback bergerak naik melawan tren, dan indikator mengukur:
-
- Kedalaman pullback (harga):
depthPrice = pullbackHigh – trendLow - Ukuran kaki impuls:
legSize = trendBasePrice – trendLow
- Kedalaman pullback (harga):
- Rumus yang sama:
Fib% = (depthPrice / legSize) * 100
Dengan cara ini, setiap titik yang Anda lihat di grafik mewakili pullback di dalam impuls yang jelas dari tren saat ini, yang dinyatakan baik dalam pips maupun dalam persentase Fibonacci, sehingga Anda dapat dengan cepat menilai apakah retracement tersebut dangkal, tipikal, atau sangat dalam.
Ringkasan
Key features include:
- Detection of trend direction and pullbacks.
- Measurement of pullback depth and Fibonacci retracement percentage.
- Live tracking of the number of pullbacks, last pullback depth, average pullback depth, and last Fibonacci retracement percentage.
- Visual chart elements such as large green dots at pullback lows in uptrends and large red dots at pullback highs in downtrends.
- Optional compact labels displaying pullback depth and Fibonacci percentage.
- A dynamic legend showing current trend direction, pullback counts, and metrics.
The Fibonacci retracement is calculated based on the last impulse leg, defined by the last significant trend base and extreme prices, providing objective numeric data to assess whether retracements are shallow, typical, or unusually deep. The indicator supports various markets including Forex, indices, commodities, cryptocurrencies, and stocks. It offers configurable parameters such as EMA period, minimum pullback size, breakout buffer, and display options for labels and legend.
Ulasan pelanggan
5 | 50 % | |
4 | 50 % | |
3 | 0 % | |
2 | 0 % | |
1 | 0 % |


