説明
🚀 チャートを戦略的意思決定センターに変革する
Smart Tech Analysisは単なるインジケーターではありません。
意思決定において明確さ、正確さ、機敏さを求めるトレーダーのために開発された、完全なインテリジェント分析ダッシュボードです。
ほとんどのインジケーターが孤立した情報のみを提供するのに対し、Smart Tech Analysisは以下を統合します:
✔ トレンド
✔ ボリューム
✔ フィボナッチ
✔ サポートとレジスタンス
✔ テクニカルシグナル
✔ オペレーション推奨
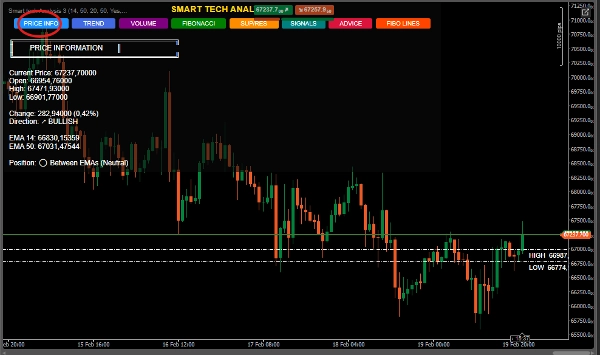
✔ 詳細な価格情報
すべてが1つの動的でインタラクティブなダッシュボードに。
🔥 大きな違い
🎯 1. 6-in-1システム – 統合分析
複数のインジケーターを切り替える必要はもうありません。
Smart Tech Analysisは以下を組み合わせます:
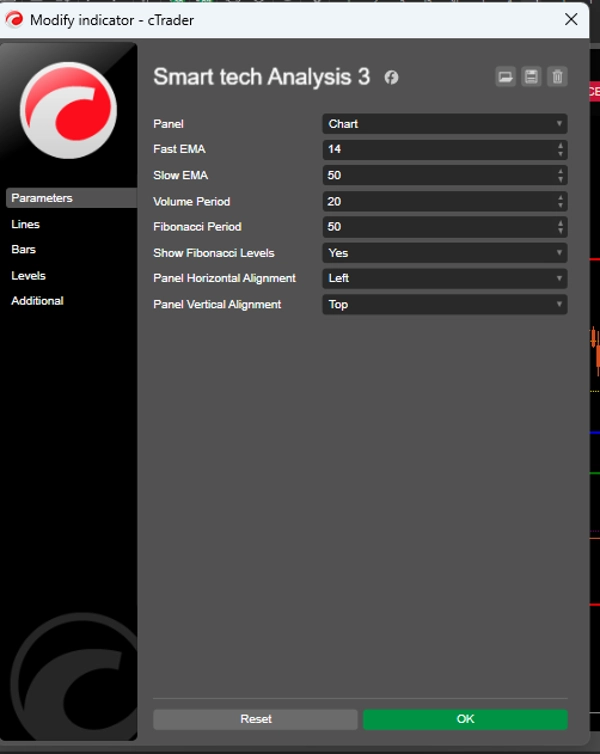
📈 速い・遅いEMA(14と50)
📊 比較分析付きボリューム
🧩 自動フィボナッチ
🛡 動的サポートとレジスタンス
🚦 インテリジェントなシグナル生成
📌 計算されたストップとターゲットを伴う推奨
👉 これにより視覚的ノイズが減り、客観性が向上します。
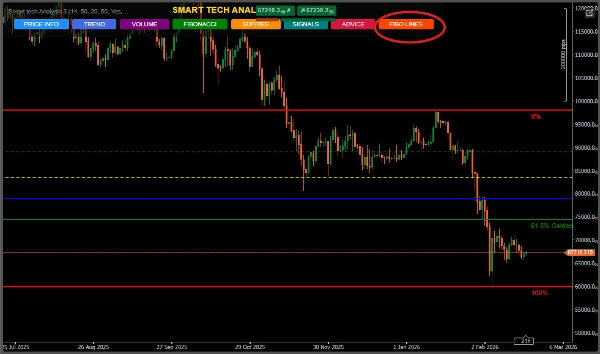
🧠 2. 独占的インタラクティブパネル
スマートボタンを備えたプロフェッショナルなインターフェース:
PRICE INFO
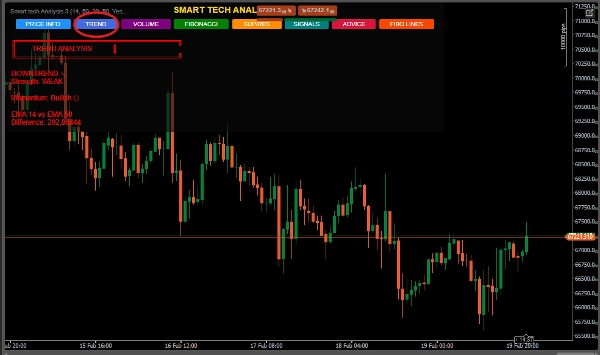
TREND
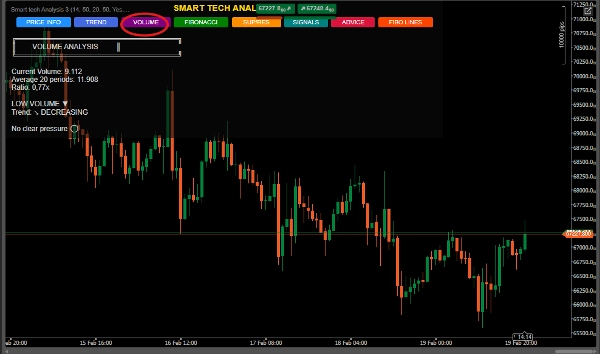
VOLUME
FIBONACCI
SUP/RES
SIGNALS
ADVICE
トレーダーは見たいものを正確に選択します。
📌 組織。
📌 コントロール。
📌 プロフェッショナリズム。
📈 3. 強さとモメンタムを伴うトレンド分析
単に上昇か下降かを示すだけではありません。
以下を計算します:
トレンドの強度
EMA間の強さのパーセンテージ
分類:弱い、中程度、強い
これにより横ばい市場での弱いエントリーを避けます。
📊 4. 機関投資家の読みを伴うボリューム
システムは以下を識別します:
極端なボリューム
買い圧力または売り圧力
加速または減速
過去の平均との比較
👉 可能な機関投資家の活動を検出するのに理想的です。
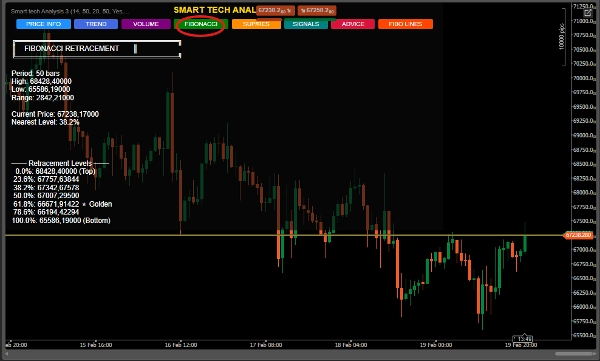
🧩 5. ゴールデンゾーンを伴う自動フィボナッチ
定義された期間にわたり動的に計算されます。
特に注目すべきは:
⭐ 61.8%ゾーン(ゴールデンゾーン)
📌 最も近いレベルの識別
📌 強気および弱気の拡張
📌 自動的な文脈に基づく推奨
戻り売りトレーダーやスイングトレーダーに最適です。
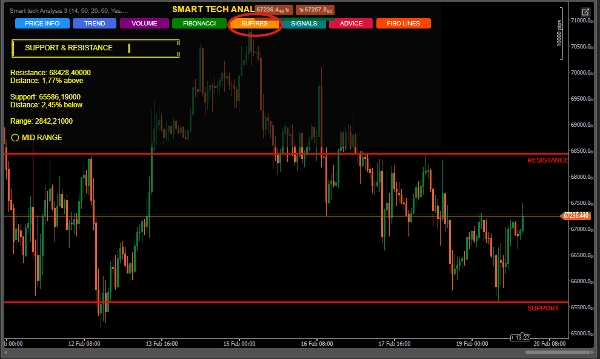
🛡 6. インテリジェントなサポート&レジスタンス
重要な高値と安値を検出
現在の価格からのパーセンテージ距離を表示
位置を分類:サポート近く、レジスタンス近く、または中間範囲
チャートに自動的にラインを描画
戦略的ゾーンへのエントリーに理想的です。
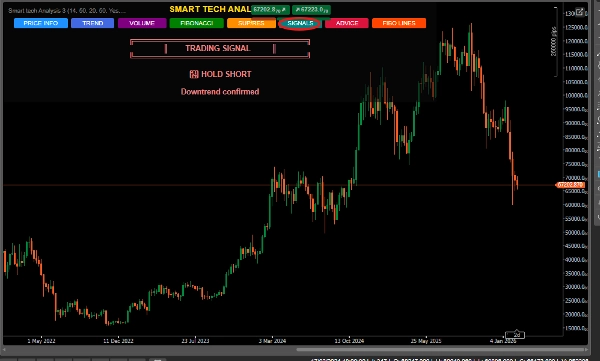
🚦 7. コンフルエンスシグナルシステム
アルゴリズムはランダムなシグナルを生成しません。
以下を組み合わせます:
✔ EMAクロスオーバー
✔ サポート/レジスタンスへの接近
✔ トレンド構造
✔ 価格の文脈
分類:
🟢 強い買い
🔴 強い売り
📈 ロング保有
📉 ショート保有
⏸ 待機
示された信頼レベル付き。
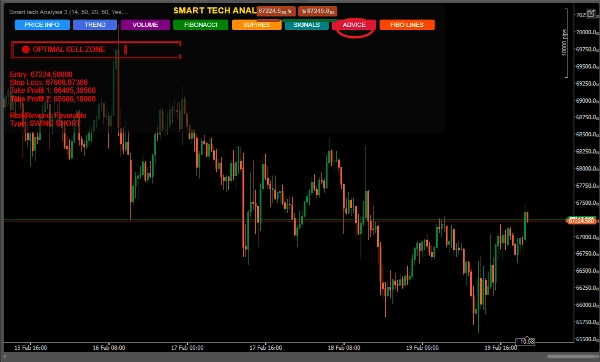
🎯 8. リスク管理を伴う推奨
「ADVICE」パネルは以下を提供します:
推奨エントリー
テクニカルストップロス
2つのテイクプロフィットターゲット
スイング構造(ロングまたはショート)
オペレーションの文脈
👉 ただの分析ではありません。
👉 それは構造化された計画です。
🏆 このインジケーターは誰のため?
✔ 明確さを必要とする初心者トレーダー
✔ コンフルエンスを求める中級トレーダー
✔ 効率を追求する上級トレーダー
✔ スイングトレーダー
✔ 構造的確認を使用するスキャルパー
💎 なぜ市場で際立っているのか? 一般的なインジケーター Smart Tech Analysis
孤立した情報 統合分析 視覚的汚染 整理されたダッシュボード 文脈なし テクニカルコンフルエンス 管理なし 推奨ストップとターゲット シンプルなシグナル 確認付きシグナル
📊 直接的な利点
✔ 感情的な決定を減らす
✔ 精度を高める
✔ 構造的読み取りを改善する
✔ 時間を節約する
✔ トレーダーのプロフェッショナル基準を引き上げる
🧠 市場でのポジショニング
Smart Tech Analysisは以下に最適です:
外国為替市場
株価指数
コモディティ
暗号通貨


