
说明
Delta 交易量指标 - cTrader 的高级订单流分析
Delta 交易量指标分析逐笔订单流,以揭示仅凭价格行为无法显示的买卖压力。它计算每根K线的上升笔数(买入)和下降笔数(卖出)之间的差异,提供真实市场参与度的洞察。
版本 1.0
当前稳定版本适用于较低时间框架(1分钟 - 15分钟)
即将推出更新!
独特之处
真实逐笔分析:非交易量近似 - 实际逐笔分类
双重背离系统:同时检测K线级和分形基础的背离
质量验证:Corwin-Schultz 价差估计确保信号可靠
灵活可视化:多种着色方法和过滤选项
完全自定义:每种颜色、阈值和显示选项均可配置
基于研究:基于同行评审的市场微观结构研究构建
------------------------------------------------------------------------------------------------------------------------------------------------------------
核心功能
------------------------------------------------------------------------------------------------------------------------------------------------------------
Delta 交易量计算
- 逐笔规则分类:每笔交易分类为买入(+1)、卖出(-1)或中性(0)
- K线 Delta:每根K线的净买卖压力 = 买入量 - 卖出量
- 累计 Delta:显示持续方向压力的运行总和
- 多种价格类型:可使用买价、卖价或中间价计算
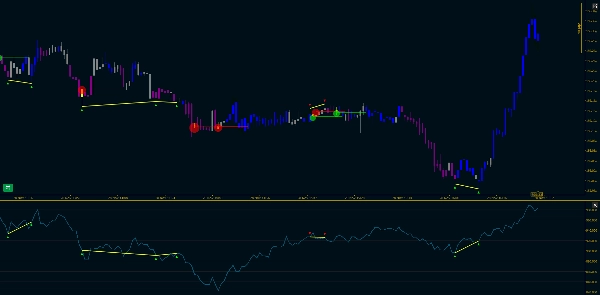
Delta 背离检测
识别价格与订单流不一致的情况——潜在的反转信号。
两种过滤方法:
- 幅度 + 不平衡:Delta 强度和交易量不平衡的直接阈值
- 基于百分位数:基于历史分布的自适应过滤
视觉标记:
- 自动放置在控制点(最高交易量价格水平)
- 大小随 Delta 幅度缩放
- 可选的趋势线向前延伸
图表蜡烛着色
根据订单流用三种优先级为蜡烛着色:
- 背离(黄色)- 最高优先级
- CVD 状态(可选)- 稳定状态识别
- K线 Delta(青柠/红色/灰色)- 按K线着色
------------------------------------------------------------------------------------------------------------------------------------------------------------
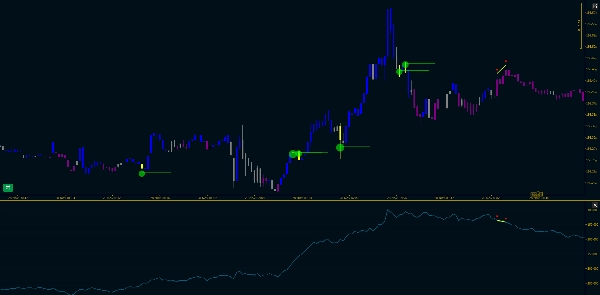
CVD 状态分析
------------------------------------------------------------------------------------------------------------------------------------------------------------
两种稳定着色方法:
1. 范围内位置
- 显示 CVD 在近期范围内的位置(0-100%)
- 上部30% = 看涨 | 下部30% = 看跌 | 中间40% = 中性
- 快速、直观、自适应
2. Corwin-Schultz 质量过滤器
- 使用实际的 Corwin-Schultz 价差估计价格
- 仅在市场流动性高(价差紧密)时信任 CVD
- 自动过滤不可靠的时期
- 基于同行评审研究(Corwin & Schultz 2012)
关键原则:CVD 仅在流动性市场中有意义。此方法在显示 CVD 信号前验证市场质量。
------------------------------------------------------------------------------------------------------------------------------------------------------------
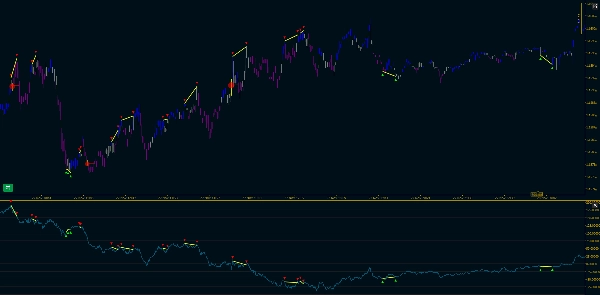
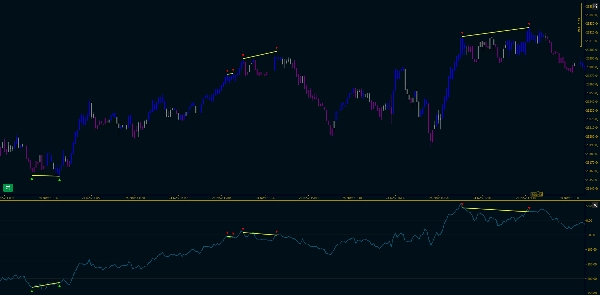
价格-Delta 分形分析
------------------------------------------------------------------------------------------------------------------------------------------------------------
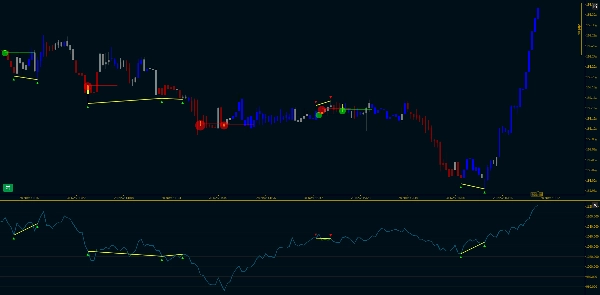
同时跟踪价格图表和累计 Delta 上的枢轴点。
功能:
- 检测具有可配置枢轴长度的高/低分形
- 顺序跟踪:跟踪连续高点或连续低点
- 背离检测:比较枢轴间价格斜率与 CVD 斜率
- 双重可视化:价格图表和指标面板上的标记和趋势线
- 可选过滤器:仅显示背离分形,视图清晰聚焦
------------------------------------------------------------------------------------------------------------------------------------------------------------
视觉输出
------------------------------------------------------------------------------------------------------------------------------------------------------------
指标面板
- Delta 直方图:白色柱(正常),黄色柱(背离)
- 累计 Delta 线:青色线显示运行订单流
- 零参考线:灰色虚线
- 分形标记:▼(高点)和▲(低点)带趋势线
价格图表
- 彩色蜡烛:订单流状态的视觉表现
- 分形标记:与指标面板同步
- 分形趋势线:连接枢轴点并突出背离
- 背离标记:控制点处的圆圈
------------------------------------------------------------------------------------------------------------------------------------------------------------
参考文献
------------------------------------------------------------------------------------------------------------------------------------------------------------
- Corwin, S. A., & Schultz, P. (2012). "A Simple Way to Estimate Bid-Ask Spreads from Daily High and Low Prices." The Journal of Finance, 67(2), 719-760.
- López de Prado, M. (2018). Advances in Financial Machine Learning, Chapter 19.
- Lee, C. M., & Ready, M. J. (1991). "Inferring Trade Direction from Intraday Data." The Journal of Finance, 46(2), 733-746.


