説明
cTraderで最も高度なメディアンインジケーターでテクニカル分析を変革しましょう!
VMM Average Medianは、精度、速度、信頼性を求めるプロのトレーダーのために設計された、クラシックなメディアンインジケーターの革新的な進化形です。最適化されたアルゴリズムとインテリジェントなトレンド検出により、このインジケーターは金融市場での真の競争優位性を提供します。
🎯 スマートトレンド検出
異なる取引スタイルに対応した設定可能なアルゴリズム(2〜5バー)
高度なノイズフィルター - ドージーや重要でないローソク足を無視
カスタマイズ可能なオフセット付きの正確な矢印
より良いシグナル品質のための強化された「スマートプライス」ロジック
🎨 完全なカスタマイズ
あらゆる戦略に適合する15以上の調整可能なパラメーター
完全にカスタマイズ可能な色、スタイル、太さ
パフォーマンスと精度の詳細なコントロール
論理的なグループに整理された直感的なインターフェース
📊 トレーダーのための利点
⚡ スキャルパーとデイトレーダー向け:
超高速応答(ミリ秒単位)
即時の反転検出
最小限のリソース消費
ティックチャートや1分チャートに最適
📈 スイングトレーダーと投資家向け:
より信頼性の高いトレンド分析
洗練されたノイズフィルタリング
長期間にわたる安定したパフォーマンス
複数の時間枠に理想的
💻 VPS/複数ペアユーザー向け:
最大80%のCPU使用率削減
最適化されたメモリフットプリント
遅延なしの同時実行
ホスティングコストの実質的な節約
🔧 高度な技術機能
インテリジェントキャッシュシステム:
通常使用時のキャッシュ効率:85-95%
定期的な自動クリーニング
ConcurrentDictionaryによるスレッドセーフ
アルゴリズムの最適化:
最適化されたO(n log n)メディアン計算
最大速度のためのメモリ事前割り当て
堅牢な境界チェック
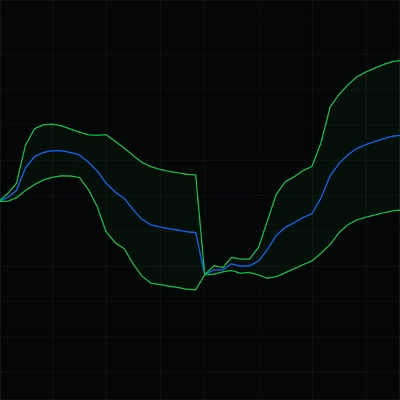
プロフェッショナルなビジュアライゼーション:
滑らかで連続的なメディアンライン
スマートな位置決めのトレンド矢印
多様なラインスタイル(実線、点線など) 強気/弱気市場のカスタマイズ可能な色
メディアン vs SMA:実際の利点
📊 仕組み:
SMA:単純平均 - すべての価格(外れ値を含む)を合計
メディアン:並べ替え後の中央値 - スパイクを自動的に無視
🎯 簡単な例:
価格:100、101、102、103、150(スパイク)
SMA:111.2 ❌(スパイクにより歪み)
メディアン:102 ✅(実際の市場価値)
⭐ 主な利点:
1️⃣ 自然なフィルター - 外れ値/スパイクを自動的に無視
2️⃣ よりクリーンなシグナル - 偽アラートを40-60%削減
3️⃣ 操作に強い - ポンプ/ダンプの影響が少ない
4️⃣ ボラティリティに最適 - 混沌とした市場でも安定性を維持
🔥 トレーダー向け:
スキャルピング:高周波ノイズをフィルター
デイトレード:より正確なエントリータイミング
スイング:ノイズではなく実際のトレンドを識別
🚀 メディアンはスマートなSMA - 実際の価格コンセンサスを示します!
概要
カスタマーレビュー
5 | 100 % | |
4 | 0 % | |
3 | 0 % | |
2 | 0 % | |
1 | 0 % |