説明
━━━━━━━━━━━━━━━━━━━━━━━━━━━━━━━━━━━━━━━━
ATRリスクビジュアライザー — リスク
━━━━━━━━━━━━━━━━━━━━━━━━━━━━━━━━━━━━━━━━
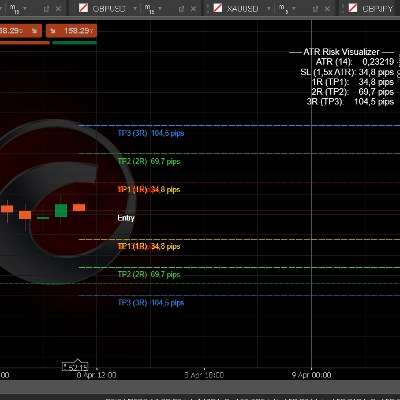
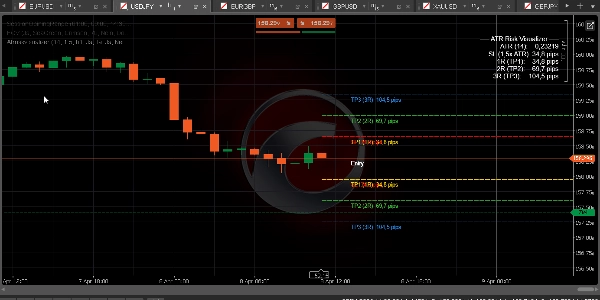
ATRに基づいてストップロスとテイクプロフィットのレベルを瞬時に可視化します — 完全なRマルチプルマッピング(1Rから5R)とピップラベル付き — これにより、ポジションを取る前に常に定義されたリスクで取引できます。
─────────────────────────────
主な特徴
► ATRベースのストップロス — SL距離はATR × 設定可能な乗数(デフォルト1.5×)で計算
► Rマルチプルテイクプロフィット — TP1(1R)、TP2(2R)、TP3(3R)、TP4(4R)、TP5(5R)が現在価格から自動描画
► 各レベルにピップラベル — SLと各TPの正確なピップ距離を一目で確認可能
► ロングとショートのレベルを同時表示 — またはロングのみ、ショートのみモードに切替可能
► ATRタイムフレームセレクター — 上位タイムフレームからATRを計算(例:M15チャートでH1 ATR)
► ATR情報パネル(右上) — ATR値、SLサイズ、TP1/2/3をピップで表示
► 完全な色のコントロール — ネイティブのcTraderカラーピッカーでSL、TP1、TP2、TP3、TP4/5の色を個別設定可能
► 設定可能なラインスタイル(実線/破線/点線)と太さ
► エントリー参照としてのAskまたはBid価格 — 取引方向に応じて選択可能
─────────────────────────────
デフォルト設定
→ ATR期間 14
→ ATR乗数 1.5×(SL = 1.5 × ATR)
→ ATRタイムフレーム H1
→ TP1/2/3表示 ON
→ TP4/5表示 OFF
→ 方向 両方(ロング+ショート)
→ SL色 赤
→ TP1色 ゴールド
→ TP2色 ライムグリーン
→ TP3色 ドジャーブルー
→ ラインスタイル 破線
─────────────────────────────
使い方
1. 任意のチャートにインジケーターを追加
2. 戦略に合わせてATR期間と乗数を設定(1.5×ATRはForex/Goldの標準)
3. スムーズなSLサイズのためにATRタイムフレームをH1またはH4に設定
4. チャートラベルから直接ピップ値を読み取る
5. TP1(1R)を最初の部分決済に、TP2(2R)を損益分岐点に、TP3(3R)を完全目標に使用
6. BOS/CHoCHおよびFVGインジケーターと組み合わせて完全なSMCエントリーワークフローを構築
─────────────────────────────
対象ユーザー
✔ リスクを正確にサイズする必要があるFTMOおよびプロップファームトレーダー
✔ Rマルチプルを使ったトレード管理を行うSMCおよびICTトレーダー
✔ 任意のタイムフレームで取引するForex、Gold、Indicesトレーダー
✔ エントリー前に明確な視覚的リスクマップを求めるトレーダー
✔ ポジションサイズの体系的アプローチを構築するすべての人
─────────────────────────────
対応環境
→ プラットフォーム cTrader(デスクトップ&ウェブ)
→ 資産クラス Forex、Indices、Commodities、Crypto CFDs
→ タイムフレーム 全て(M1からMNまで)
→ アクセス権限 不要
→ アカウントタイプ ライブ&デモ
━━━━━━━━━━━━━━━━━━━━━━━━━━━━━━━━━━━━━━━━
概要
カスタマーレビュー
5 | 50 % | |
4 | 50 % | |
3 | 0 % | |
2 | 0 % | |
1 | 0 % |