MACD Custom Indicator - Multiple Time Frame
インジケーター
バージョン 1.0、May 2026
Windows、Mac
4.0
レビュー: 2
Trading product for MACD Custom Indicator - Multiple Time Frame インジケーター EMA Volume, image 2
Trading product for MACD Custom Indicator - Multiple Time Frame インジケーター EMA Volume, image 3
Trading product for MACD Custom Indicator - Multiple Time Frame インジケーター EMA Volume, image 4
Trading product for MACD Custom Indicator - Multiple Time Frame インジケーター EMA Volume, image 5
46
販売
3.93K
無料インストール

説明

🔥 **PrimeQuant CM Ultimate MACD MTF v1.0** 🔥


**完璧なTradingViewからcTraderへのMACDアップグレード**

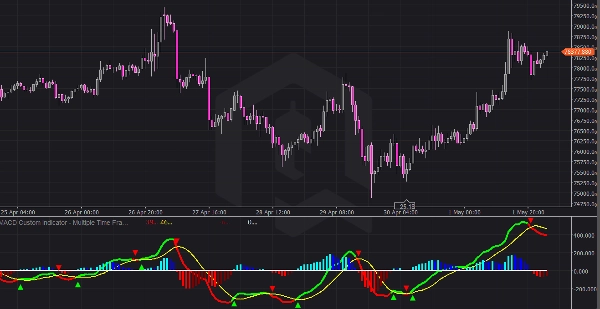
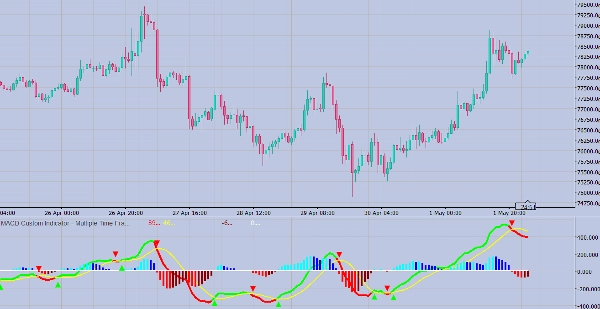
✅ 有名なCM MACD Ultimate MTF Pine Scriptの正確なビジュアルレプリカ

✅ マルチタイムフレーム対応(現在のチャートまたはカスタムHTF)

✅ 動的な緑/赤のトレンドカラーリングを持つ連続したMACDライン

✅ 黄色のシグナルライン

✅ 4色のヒストグラム(ゼロの上下の遷移)

✅ 三角形のクロスシグナル(完璧な間隔の上下矢印)

✅ ゼロ参照線


**🎯 主な特徴:**

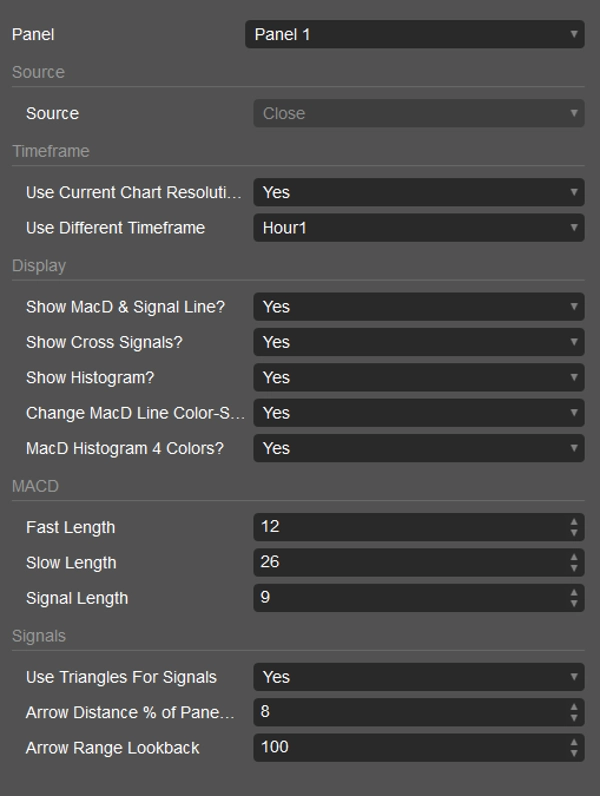
- **📊 MTFの柔軟性**: 現在の時間枠を使用するか、カスタムHTF(1分〜1ヶ月)を選択

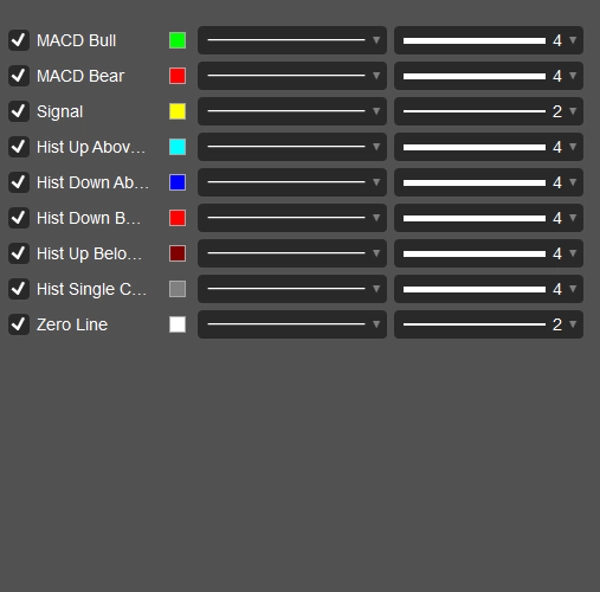
- **🎨 スマートカラーリング**: シグナルクロス時にMACDラインが緑/赤に変化

- **📈 4色ヒストグラム**: ゼロ以上はアクア/青、ゼロ以下は赤/マルーン

- **🔺🔻 三角形シグナル**: クロスポイントにクリーンな上下矢印

- **⚙️ 完全カスタマイズ**: 各要素を独立して切り替え可能


**🚀 使い方:**

1. **チャートに追加** → 別パネルに表示されます

2. **現在のTF** → 「現在のチャート解像度を使用」にチェック(デフォルト)

3. **高いTF** → チェックを外して時間枠を選択(例:M5チャート上のH1)

4. **シグナル** → 「クロスシグナルを表示」を有効にして三角形マーカーを表示

5. **カスタマイズ** → 色、距離、ヒストグラムスタイルを調整


**📈 トレーディングシグナル:**

- 🔺 **緑の上向き三角形** = MACDがシグナルを上抜け(強気)

- 🔻 **赤の下向き三角形** = MACDがシグナルを下抜け(弱気)

- **緑のMACD** = シグナルの上(強気バイアス)

- **赤のMACD** = シグナルの下(弱気バイアス)

- **ヒストグラムのダイバージェンス** = モメンタムの変化に注意


**💎 PrimeQuantの品質**

cTrader用に構築 5.6.10+ | エラーゼロ | ネイティブパフォーマンス | プロフェッショナルなビジュアル


**⭐ 以下に最適:** スキャルパー、スイングトレーダー、低時間軸チャートでのHTF分析

概要

AIによる概要
The MACD Custom Indicator - Multiple Time Frame is a momentum indicator designed for the cTrader platform, replicating the visual style of the CM MACD Ultimate MTF Pine Script from TradingView. It supports multi-timeframe analysis, allowing users to apply the MACD calculation on the current chart timeframe or select a custom higher timeframe ranging from 1 minute to 1 month. The indicator features a continuous MACD line that dynamically changes color (green/red) based on trend direction, a yellow signal line, and a four-color histogram that visually distinguishes momentum shifts above and below zero. Triangle-shaped cross signals mark bullish and bearish MACD-signal line crossovers with up and down arrows, respectively. A zero reference line is also included for trend context. Users can fully customize the display elements independently, including colors, distances, and histogram styles. The indicator appears in a separate panel on the chart and is suitable for scalpers, swing traders, and higher timeframe analysis on lower timeframe charts. It provides visual signals for trend strength, crossovers, and potential momentum divergences to assist in trading decisions.
インジケーターのプロフィール
インジケーターのカテゴリー
モメンタム
出力の種類
ビジュアル表示
シグナル
データ要件
バーのみ
サポート対象のシグナル
クロス
ダイバージェンス
反転
トレンドの強さ

カスタマーレビュー

4.0
レビュー: 2
5
0 %
4
100 %
3
0 %
2
0 %
1
0 %
カスタマーレビュー
May 17, 2026
messy signals are easier to question, but it should not replace the chart.
May 16, 2026
Demo first, then maybe small size if the notes look sane, and forcing the entry still creates problems.

ディスカッション

よくあるご質問

EMA
Volume
MACD
Triangle
Moving Average
VWAP
Support & Resistance
cTrader Storeで入手可能な取引ボット、インジケーター、プラグインなどの商品は、第三者の開発者が提供するものであり、情報と技術の取得のみを目的としてご利用いただけます。cTrader Storeはブローカーではなく、投資助言や個人的な推奨を行うことも、将来のパフォーマンスを保証することもありません。

この作成者の他の商品

インジケーター
ATR
SMC
+19
Free Smart Money Concepts from TradingView for cTrader: BOS/CHoCH, OB, FVG, liquidity, MTF levels, discount zones.
インジケーター
ATR
SMC
+18
Precision SMC tool with HTF sweeps, MSS confirmation & smart FVG detection for high-probability reversals.
インジケーター
ATR
Prop
+16
Get the exact SuperTrend experience from TV, now perfectly rebuilt for cTrader
インジケーター
Prop
ZigZag
+5
All-in-One ICT/SMC Institutional Framework — Ranges, Structure, Liquidity, Fibonacci & Time Engine.
インジケーター
RSI
MACD
+5
WaveTrend Oscillator with signal line, spread histogram and OB/OS levels for precise momentum trading.
インジケーター
ATR
SMC
+19
Smart Liquidity Sweep detector with auto-drawing True Channels and real market structure mapping.
インジケーター
Forex
BTCUSD
+11
📈 Adaptive ALMA-Gaussian hybrid trend filter with precision smoothing and clear buy/sell signals.
インジケーター
SMC
Forex
+15
Smart institutional order block & FVG scanner with alerts, zone merging, and HTF confluence.
cBot
SMC
Forex
+11
💎 ICT Silver Bullet Strategy cBot — liquidity sweep & breakout algorithm with risk control.
インジケーター
Forex
Crypto
+5
🚀 Automated Elliott Wave & Fibonacci tool for cTrader. Spot trends, corrections & retracements fast.
インジケーター
ADX
ATR
+5
Precision Sniper by PrimeQuant: Advanced confluence engine with auto-presets, dynamic TP/SL, and live backtest stats.
インジケーター
ATR
SMC
+17
Adaptive Swing-Anchored VWAP that tracks market structure shifts with precision and clarity.

これも好きかも

インジケーター
RSI
Indicator Stochastic With RSI
インジケーター
Forex
Detects valid Fair Value Gaps from strong 3-bar patterns. Keep drawing unfilled gaps until price fills them.
インジケーター
ATR
Prop
Outside Candle Detector: Highlights major candles/zones with ATR filter & pattern labels. By Avydel Talbo, prop trader.
インジケーター
SMC
Prop
+18
Fixed Range Volume Profile (FRVP) : analyzes price volume within a custom rectangle to find POC, VAH, and VAL.
インジケーター
Customize your Moving Average! Choose any timeframe and price source for precision and flexibility in your analysis.
インジケーター
SMC
Forex
+4
Identifies institutional zones with Volume Delta (K) across any asset or chart for high-precision entry detection.
インジケーター
MCDX is a powerful and innovative indicator.
インジケーター
Key Levels
Liquidity Grab
+3
Visual market context dashboard showing bias states, CE positioning, session status and sweep context.
インジケーター
News Filter
External Data
+3
Real-time financial news and economic calendar overlay for cTrader with smart alerts
インジケーター
VWAP
Volume
+3
Don't trust static support and resistance levels, this indicator combines Fibonacci and VWAP in one powerful tool.
インジケーター
BOS
MSS
+3
Orderblocks with Multi-Timeframe.
インジケーター
AI
SMC
+14
Refined cleaner version of Key Levels indicator with broker UTC offset, styles & label alignment.
インジケーター
RSI
Signal
+1
Multi-timeframe version of the Quantitative Qualitative Estimation (QQE) indicator.
インジケーター
BOS
MSS
+3
Maps BOS, CHoCH, swing breaks and market structure shifts directly on your cTrader chart.
インジケーター
RSI
SMC
+3
High Low Divergence is a clean, overlay indicator that automatically identifies swing highs and swing lows
インジケーター
AI
SMC
+15
Multi-Timeframe Swing Points Indicator for cTrader that identifies swing highs and lows on both the current timeframe.
インジケーター
A compact, visual multi-timeframe trend indicator for cTrader. Easily spot bullish or bearish trends across 4 customizab
インジケーター
Visually master the Inside Bar strategy with clear breakout signals and professional chart highlighting 📈🔔📉

価格

46
販売
3.93K
無料インストール