
present
ลงทะเบียนและรับส่วนลด $50 สำหรับการซื้อครั้งแรกของคุณ
Trading product for first 4h candle of the day guide yahuah yahusha อินดิเคเตอร์ Key Levels BOS, image 1
first 4h candle of the day guide yahuah yahusha
อินดิเคเตอร์
เวอร์ชัน 1.0, Sep 2026
Windows, Mac
Trading product for first 4h candle of the day guide yahuah yahusha อินดิเคเตอร์ Key Levels BOS, image 2
Trading product for first 4h candle of the day guide yahuah yahusha อินดิเคเตอร์ Key Levels BOS, image 3

คำอธิบาย

This indicator analyses the first 4-hour candle of each trading day to establish a daily price range. It identifies the high, low, and the close of the preceding 4H candle — three key levels that institutional traders and algorithms reference heavily at the start of each session. It also analyses 15-minute swing structure to determine the current market bias. this indicator can be used on any market prefer indices.


How to interpret signals and visual elements

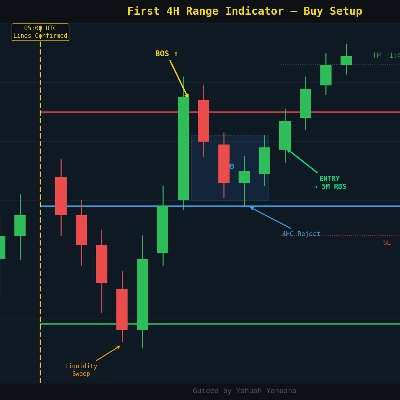
  • Red horizontal line — the high of the first 4H candle. Acts as the upper boundary of the daily range and a potential resistance level
  • Green horizontal line — the low of the first 4H candle. Acts as the lower boundary and potential support
  • Blue horizontal line (4HC) — the close of the previous 4H candle, marking where price stood at the start of the new day. Often acts as a mid-range liquidity level
  • Gold vertical line — marks the exact bar where all levels were confirmed, making it easy to see when the range was set
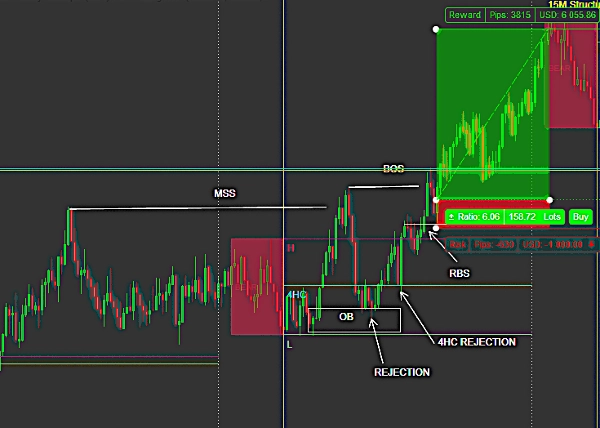
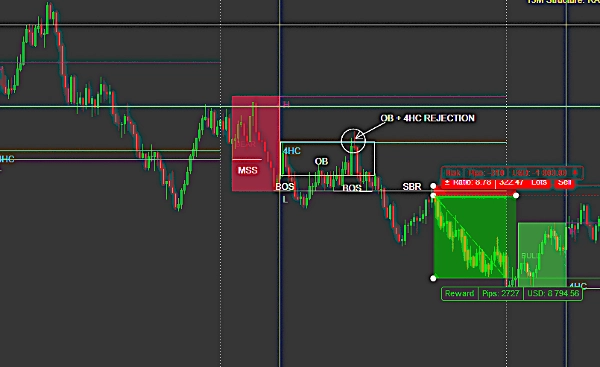
  • 15M Structure panel — displays Bullish, Bearish, or Ranging bias based on recent swing highs and lows, with HH/HL/LH/LL labels plotted on the chart

All lines appear solid and locked the moment the first 4H candle closes. Nothing repaints or moves after confirmation.


Key settings and parameters

  • Max History Days — controls how many past days of levels are displayed
  • Show 4H Close at Day Open — toggles the blue 4HC line on/off
  • Show Day-Start Gold Line — toggles the gold vertical line
  • Show Vertical Markers — bounded tick marks at the range boundaries for visual reference
  • 15M Structure Bias — toggle swing labels and bias panel (5M chart only)
  • Swing Lookback / Swing Count — controls sensitivity of structure detection
  • Full color, thickness, and line style customisation for every element


Typical use cases and trading scenarios

  • Using the H and L as a daily range to look for reversals or breakouts during killzones (London/NY open)
  • Using the 4HC level as a mid-range target or confluence entry level
  • Combining the range with SMC, ICT, or CRT frameworks for high-probability setups
  • Checking the 15M bias panel before taking a 5M entry to ensure structural alignment


Who this indicator is best suited for

Intermediate to advanced intraday traders who use the daily opening range as a structural reference. Particularly suited to traders using Smart Money Concepts (SMC), ICT, or similar methodologies. Works across all timeframes but pairs best with 5M or 1M for entry precision.


Important limitations and usage notes

  • Levels only appear after the first 4H candle of the day closes — no levels are shown while that candle is still forming
  • The exact time levels appear depends on your broker's 4H candle alignment. On Deriv, the first 4H candle opens at 01:00 UTC and closes at 05:00 UTC
  • The 15M structure bias panel is restricted to the 5M chart only
  • For best scroll performance, disable the gold vertical line or reduce Max History Days if experiencing lag


สรุป

โปรไฟล์อินดิเคเตอร์
หมวดหมู่อินดิเคเตอร์
โครงสร้างตลาด (SMC)
ประเภทเอาต์พุต
ตัวกรอง
ข้อกำหนดด้านข้อมูล
แท่งเท่านั้น

รีวิวจากลูกค้า

0.0
รีวิว: 0
รีวิวจากลูกค้า
ยังไม่มีรีวิวสำหรับผลิตภัณฑ์นี้ หากเคยลองแล้ว ขอเชิญมาเป็นคนแรกที่บอกคนอื่น!

การสนทนา

คำถามที่พบบ่อย

Key Levels
BOS
Liquidity Grab
ผลิตภัณฑ์ที่มีให้บริการผ่าน cTrader Store รวมถึงบอทการเทรด อินดิเคเตอร์ และปลั๊กอิน มีให้บริการโดยนักพัฒนาบุคคลที่สามและมีไว้เพื่อวัตถุประสงค์ในการเข้าถึงข้อมูลและทางเทคนิคเท่านั้น cTrader Store ไม่ใช่โบรกเกอร์และไม่ได้ให้คำแนะนำการลงทุน คำแนะนำส่วนบุคคล หรือการรับประกันผลการดำเนินงานในอนาคต

เพิ่มเติมจากผู้เขียนคนนี้

อินดิเคเตอร์
Volume
Key Levels
+2
Support and resistance from a rolling volume profile, ranked by strength or recency, updated live.

นอกจากนี้คุณยังอาจชอบ

อินดิเคเตอร์
Key Levels
Support & Resistance
Clean psychological round-number grid with native pip and point auto-scaling across Forex, Gold, Indices, and Crypto.
"OrderPrice-V3" โลโก้
เรตติ้งสูง
4.0
(4)
$19
อินดิเคเตอร์
RSI
MACD
+2
A straightforward yet effective tool signals entry points for both buying and selling. Include 3 Moving Average
อินดิเคเตอร์
Support & Resistance
Detects Gartley, Bat, Butterfly, Crab, Shark & Cypher patterns and backtests each one's real win rate.
อินดิเคเตอร์
Volume
Imbalance
+1
Volume profile indicator that auto-detects the latest trendline. Shows POC, Value Area (VAH/VAL), and High Volume Nodes
"ZigZag Structure Pro" โลโก้
เรตติ้งสูง
4.2
(4)
$19
/
$20
อินดิเคเตอร์
Forex
BTCUSD
+12
🎯Automatically identifies the market's significant turning points (key H & L) and draws dynamic support and.....✍️
อินดิเคเตอร์
Forex
EURUSD
+5
Fimathe Indicator - Fimathe PCM - Automated Trend Channels & Levels — Ideal for live trading and backteting
อินดิเคเตอร์
Visually master the Inside Bar strategy with clear breakout signals and professional chart highlighting 📈🔔📉
อินดิเคเตอร์
SMC
BTCUSD
+9
Detects CHoCH breakouts, draws interest zones & auto Fibo. Built for Smart Money & Price Action Engulfing confirmation
"Smart Money Gaps" โลโก้
ยอดนิยม
4.6
(5)
$20
/
$40
อินดิเคเตอร์
AI
ATR
+27
Smart Money Gaps: MTF FVG auto-detection, extension, and mitigation marker. Trade institutional imbalances.
"QX TradeDecision" โลโก้
เรตติ้งสูง
4.5
(4)
$20
/
$22
อินดิเคเตอร์
ATR
Flag
+5
Decision panel with Buy/Sell scores, market bias, setup quality, trading cost and clear trade reasons.
อินดิเคเตอร์
ATR
EMA
+3
The UTBot you know from TradingView — now on cTrader with confirmed signals, VWAP, EMA and session overlays.
อินดิเคเตอร์
Prop
Forex
+14
Automatically plots Fibonacci retracement levels using the highest and lowest points of a customizable time range
อินดิเคเตอร์
RSI
Breakout
+1
🚀 TrendHeikinMultiMA: Advanced trend detection using Heikin-Ashi smoothing & MAs! Eliminates noise, confirms real trend
อินดิเคเตอร์
Forex
EURUSD
+3
Forex Strength Meter for cTrader: 4 custom currencies, cross alerts, visual arrows. Trade smarter!
"Divergence Suite VPro" โลโก้
เรตติ้งสูง
4.5
(4)
$25
/
$39
อินดิเคเตอร์
RSI
SMC
+17
RSI, MACD, Stochastic, CCI & Momentum divergence scanner with confluence scoring. Never miss a signal again!
อินดิเคเตอร์
Engulfing
Fibonacci
+4
Six higher-timeframe candle sets on one chart, with liquidity sweep detection and swept levels.
อินดิเคเตอร์
ATR
Volume
+5
Order blocks with measured hold-rate stats and confidence scoring — not just zones on a chart.
อินดิเคเตอร์
Prop
Forex
+5
Traders Panel: Scan 15 pairs across 5 timeframes. Live heatmap, strength rankings and best setups in one panel.

ราคา


















