Description
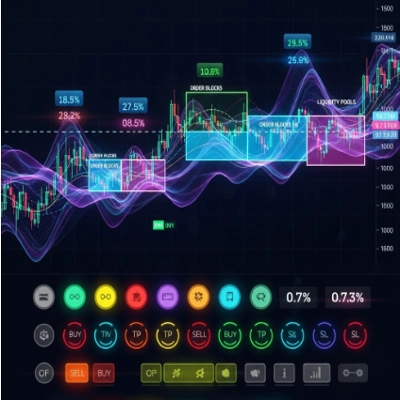
L'indicateur BLOCK LIQUIDITY combine deux approches principales de l'analyse de marché :
Détection des blocs d'ordres :
Identifie les zones de support et de résistance basées sur des plus hauts et plus bas non franchis durant une période de retour en arrière.
Génère des signaux d'achat lorsque le prix clôture au-dessus d'un plus bas non franchi.
Génère des signaux de vente lorsque le prix clôture en dessous d'un plus haut non franchi.
Analyse de la liquidité :
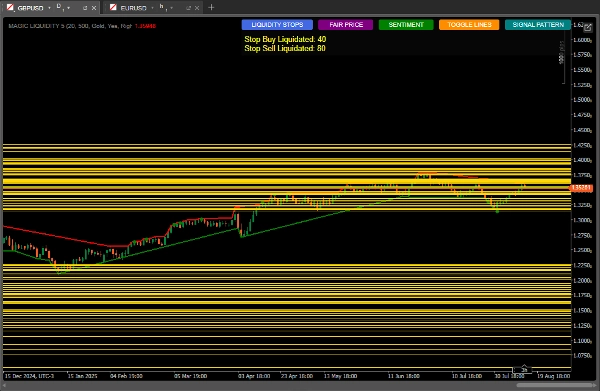
Détecte les pools de liquidité (zones où les stops de pertes peuvent être concentrés).
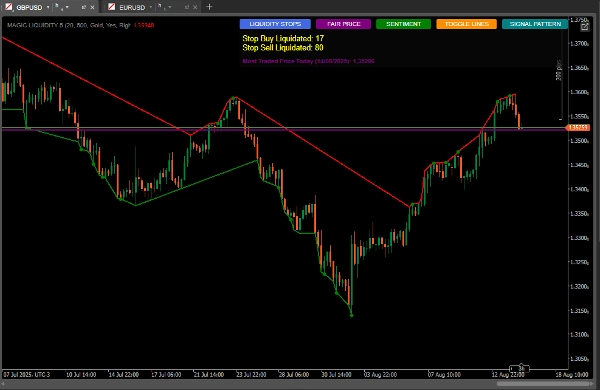
Surveille l'activation des stops d'achat et de vente.
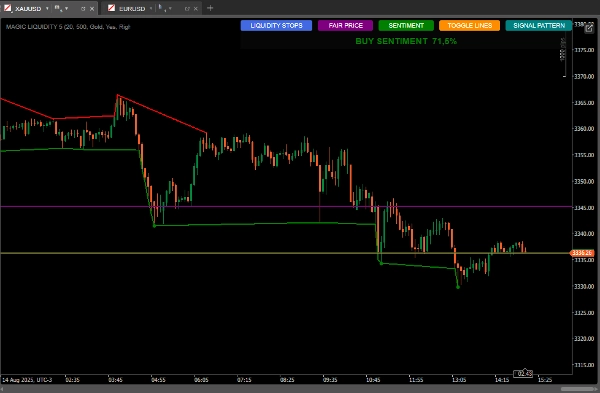
Calcule le sentiment du marché basé sur la distribution de la liquidité.
Identifie le prix le plus échangé (prix équitable).
Comment utiliser pour de meilleurs résultats
Configuration initiale
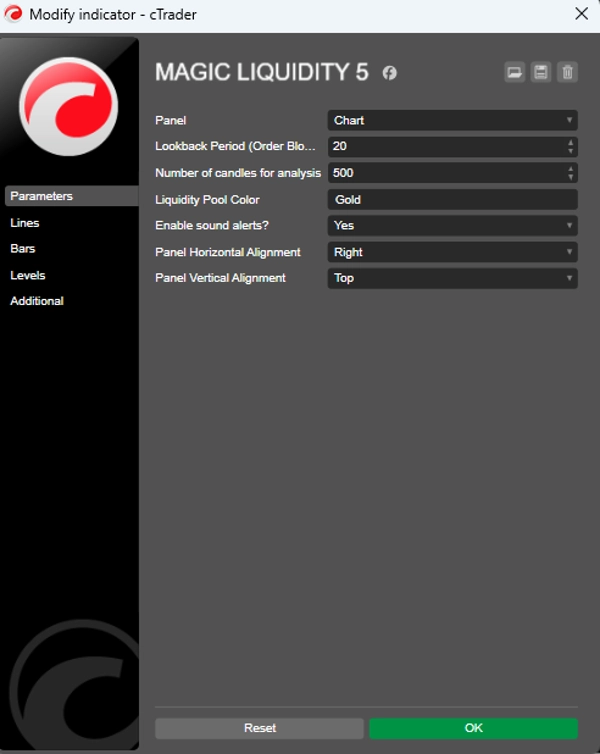
Période de retour en arrière : Ajustez le paramètre "Lookback Period" selon la période de temps sur laquelle vous tradez (valeurs plus élevées pour des périodes plus longues).
Nombre de chandeliers pour l'analyse : Gardez-le à 500 pour une analyse robuste ou réduisez-le pour des réactions plus rapides.
Couleur du pool de liquidité : Choisissez une couleur qui ressort sur votre graphique.
Interprétation des signaux
Signaux des blocs d'ordres :
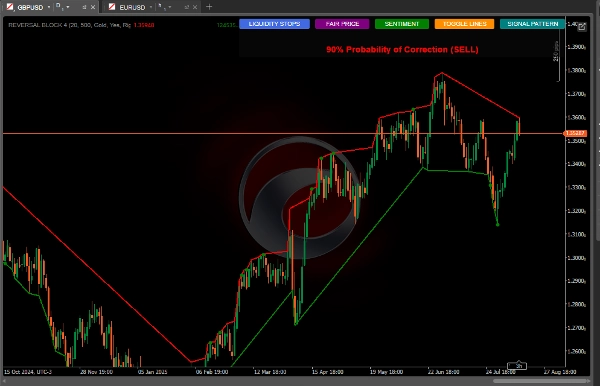
Points verts : signaux d'achat lorsque le prix clôture au-dessus d'un plus bas non franchi.
Points rouges : signaux de vente lorsque le prix clôture en dessous d'un plus haut non franchi.
Pools de liquidité :
Les lignes horizontales montrent les zones de liquidité (cibles potentielles ou points de retournement).
Surveillez la relation entre la liquidité au-dessus/en dessous du prix actuel.
Sentiment du marché :
Utilisez le bouton "SENTIMENT" pour voir la direction et la confiance dominantes.
Un sentiment d'achat avec une forte confiance suggère une croissance continue. Un sentiment de vente avec une forte confiance suggère une continuation baissière.
Modèles de chandeliers :
Le bouton "SIGNAL PATTERN" analyse et
Montre les probabilités de correction basées sur le ratio quantitatif
Prix le plus échangé (Prix équitable) :
Le bouton "FAIR PRICE" montre le niveau de prix avec le plus grand volume de la journée.
Il peut agir comme un aimant pour les prix ou comme support/résistance.
Stratégies d'utilisation
Stratégie conservatrice :
Tradez uniquement lorsque les signaux des blocs d'ordres coïncident avec le sentiment dominant.
Utilisez les pools de liquidité comme objectifs de prise de profit.
Stratégie agressive :
Anticipez les retournements lorsque le prix approche des pools de liquidité avec de nombreux stops accumulés.
Utilisez les divergences entre le sentiment et l'action des prix pour des trades contre-tendance.
Confirmation supplémentaire :
Comparez avec le modèle de chandelier montré par l'indicateur.
Vérifiez si le prix équitable est à proximité comme zone d'intérêt.
Gestion des risques.
Stop-Loss :
Placez-le en dessous du bloc d'ordre le plus récent pour les achats
Placez-le au-dessus du bloc d'ordre le plus récent pour les ventes
Take-Profit :
Objectifs dans les pools de liquidité proches
Considérez le ratio de liquidité au-dessus/en dessous pour définir les objectifs
Conseils avancés
Utilisez le bouton "TOGGLE LINES" pour désactiver les lignes de liquidité lorsque le graphique devient encombré
Surveillez le nombre de stops liquidés pour évaluer la force du mouvement
Le prix équitable est particulièrement utile dans les marchés en range comme support/résistance dynamique
Combinez avec d'autres indicateurs pour confirmation (volume, moyennes mobiles)
Volume de l'indicateur :
https://ctrader.com/pt/products/635


![Logo de "[Hamster-Coder] Pivot Points MTF"](https://cdn.ctrader.com/image/webp/4c143e5a-309c-40e3-a578-f04d1e133ffa_31159)