
설명
TrendFibonacci 지표는 트레이더가 중요한 가격 수준과 시장 추세를 정확하게 식별할 수 있도록 설계되었습니다. 피보나치 되돌림 수준을 가중 이동 평균(WMA) 및 평균 진폭(ATR)과 통합하여 이 지표는 지지, 저항 및 추세 방향을 명확하고 시각적으로 표현합니다.
주요 특징:
- 동적 피보나치 수준: 사용자 정의 조회 기간 동안 최고점과 최저점을 기준으로 피보나치 되돌림 수준(기본값: 0.382 및 0.618)을 자동으로 계산하고 표시합니다.
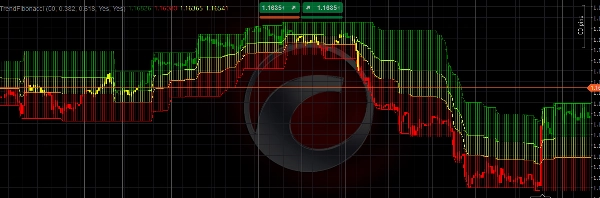
- 가중 이동 평균(WMA): 6기간 WMA를 사용하여 추세 방향을 측정하며, 피보나치 수준에 대한 WMA 위치에 따라 색상으로 구분된 캔들(강세는 녹색, 약세는 빨간색, 중립은 노란색)을 표시합니다.
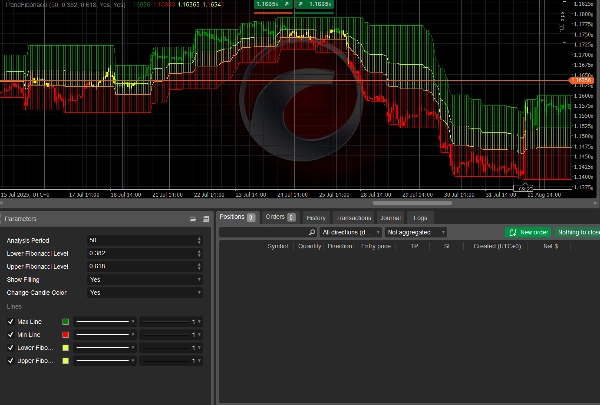
- 사용자 정의 가능한 매개변수: 분석 기간, 피보나치 수준을 조정하고 채워진 영역 및 캔들 색상 변경과 같은 기능을 켜고 끌 수 있습니다.
- 시각적 명확성: 최고/최저선과 피보나치 수준 사이 영역을 반투명 색상으로 채워 추세 식별을 용이하게 합니다.
- ATR 통합: 200기간 ATR을 포함하여 강력한 시장 분석을 제공하며 변동성에 적응할 수 있습니다.
이 지표는 피보나치 분석과 추세 추종 전략을 결합하려는 트레이더에게 이상적입니다. 외환, 주식 또는 상품을 거래하든, TrendFibonacci 는 주요 반전 구역을 식별하고 정보에 입각한 거래 결정을 내리는 능력을 향상시킵니다.
사용 방법
- 지표 설치:
-
- 소스 코드를 업로드하거나 마켓플레이스에서 다운로드하여 TrendFibonacci 지표를 cTrader 플랫폼에 추가합니다.
- 매개변수 구성:
-
- 분석 기간: 최고/최저 가격 계산 범위를 결정하기 위해 조회 기간(기본값: 50봉)을 설정합니다.
- 하단 피보나치 수준: 하단 피보나치 되돌림 수준을 조정합니다(기본값: 0.382).
- 상단 피보나치 수준: 상단 피보나치 되돌림 수준을 조정합니다(기본값: 0.618).
- 채우기 표시: 피보나치 수준 사이의 채워진 영역을 활성화/비활성화합니다(기본값: 활성화).
- 캔들 색상 변경: WMA 위치에 따른 색상 구분 캔들을 활성화/비활성화합니다(기본값: 활성화).
- 지표 해석:
-
- 녹색 캔들: WMA가 상단 피보나치 수준 위에 있을 때 강세 추세를 나타냅니다.
- 빨간색 캔들: WMA가 하단 피보나치 수준 아래에 있을 때 약세 추세를 신호합니다.
- 노란색 캔들: WMA가 피보나치 수준 사이에 있을 때 중립 구역을 제안합니다.
- 채워진 영역: 최고/최저선과 피보나치 수준 사이의 주요 가격 구역을 시각화하여 지지/저항 분석에 도움을 줍니다.
- 거래 적용:
-
- 피보나치 수준에서 잠재적인 진입/퇴출 지점을 식별하는 데 지표를 사용하세요.
- 확인을 위해 RSI, MACD 등 다른 기술 도구와 결합하세요.
- 추세 강도와 방향을 평가하기 위해 색상 구분된 캔들을 모니터링하세요.
- 최선의 실천법:
-
- 데모 계정에서 지표를 테스트하여 동작에 익숙해지세요.
- 거래 스타일과 시장 상황에 맞게 매개변수를 조정하세요.
- 더 신뢰할 수 있는 신호를 위해 상위 시간대(예: H1, H4)에서 사용하세요.
TrendFibonacci 지표는 모든 수준의 트레이더에게 적합한 다목적 도구로, 시장 추세와 가격 수준에 대한 명확하고 실행 가능한 통찰력을 제공합니다.
요약
AI 요약
TrendFibonacci is a technical indicator designed for traders to identify key price levels and market trends by integrating Fibonacci retracement levels with a 6-period Weighted Moving Average (WMA) and a 200-period Average True Range (ATR). It automatically calculates and plots dynamic Fibonacci levels (default 0.382 and 0.618) based on the highest high and lowest low over a user-defined lookback period. The indicator uses color-coded candles—green for bullish, red for bearish, and yellow for neutral—to reflect the WMA’s position relative to the Fibonacci levels, aiding in trend direction assessment.
Users can customize parameters such as the analysis period, Fibonacci levels, and visual features like filled zones between Fibonacci levels and candle color changes. The indicator visually highlights support and resistance zones by plotting high/low lines and filling areas between Fibonacci levels with semi-transparent colors. It is applicable across various markets including forex, stocks, commodities, and popular symbols like BTCUSD, EURUSD, GBPUSD, and XAUUSD.
TrendFibonacci supports traders in spotting potential entry and exit points at Fibonacci levels and can be combined with other technical tools like RSI and MACD for confirmation. It is recommended for use on higher timeframes (e.g., H1, H4) to enhance signal reliability.
지표 프로필
고객 리뷰
0.0
리뷰: 0
고객 리뷰
이 상품에 대한 리뷰가 아직 없습니다. 이미 사용해 보셨나요? 다른 사람들에게 가장 먼저 소개해 주세요!
상담
자주 묻는 질문(FAQ)
BTCUSD
Forex
Signal
EURUSD
Commodities
GBPUSD
NZDUSD
RSI
Fibonacci
Stocks
XAUUSD
NAS100
ATR
MACD
USDJPY
트레이딩 봇, 지표, 플러그인 등 cTrader Store에서 제공되는 상품은 제3자 개발자에 의해 제공되며, 이는 단순히 정보 및 기술적 접근을 목적으로 제공된 것입니다. cTrader Store는 중개인이 아니며, 투자 조언, 개인별 추천 또는 향후 성과에 대한 어떠한 보장도 제공하지 않습니다.
이 작성자의 상품 더 보기


가격
70.38M
거래량
588.67K
핍 수익
59
판매
4.42K
무료 설치