
Açıklama
Devrim Niteliğindeki Trend Takip Teknolojimizle Kesin Ticaretin Kilidini Açın
BrickAlgo TrendTracker, özellikle cTrader için tasarlanmış nihai trend tanımlama göstergesidir. Bu güçlü teknik araç, önemli piyasa dönüşlerini kolayca tespit etmenize yardımcı olur ve optimal giriş ve çıkış noktaları için net görsel sinyaller sağlar.
Ana Özellikler:
- Dinamik Trend Tespiti: Fiyat hareketi analizine dayalı trend değişikliklerini belirler
- Görsel Sinyal Sistemi: Renk kodlu oklar yükseliş ve düşüş trend değişimlerini gösterir
- Performans Takibi: İsteğe bağlı pip değeri gösterimi sinyaller arasındaki kar/zararı gösterir
- Özelleştirilebilir Ayarlar: Ticaret stilinize ve zaman diliminize uyacak şekilde parametreleri ayarlayın
- Temiz Grafik Arayüzü: Üst üste bindirme tasarımı grafiklerinizi dağınıklıktan uzak tutar
Nasıl Çalışır:
BrickAlgo TrendTracker, mevcut değerleri yüksek ve düşük fiyatların düzeltilmiş ortalamalarıyla karşılaştırarak fiyat hareketlerini analiz eder. Önemli bir desen değişikliği tespit edildiğinde, gösterge bir sinyal üretir ve böylece potansiyel trend dönüşlerini diğer tüccarlara belli olmadan önce tanımlamanıza yardımcı olur.
İşte göstergenin nasıl kullanılacağına dair kısa bir açıklama:
- Göstergeleri Yükleyin: Göstergeleri cTrader'daki göstergeler menüsünden grafiğinize ekleyin.
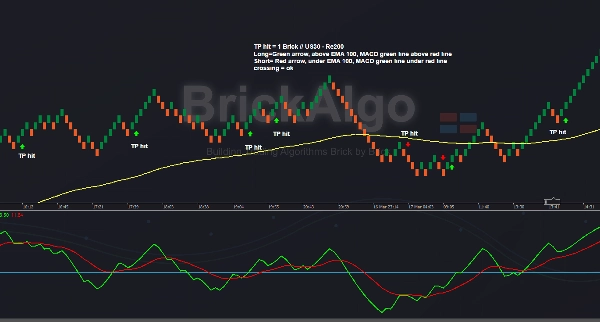
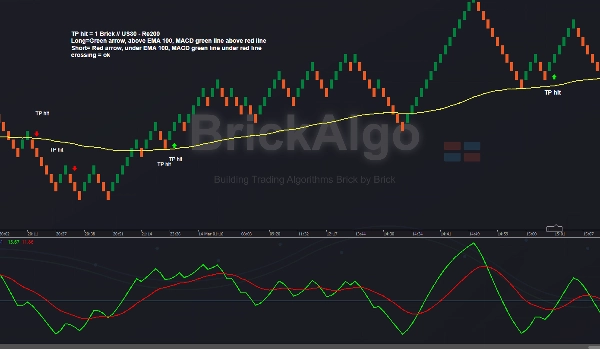
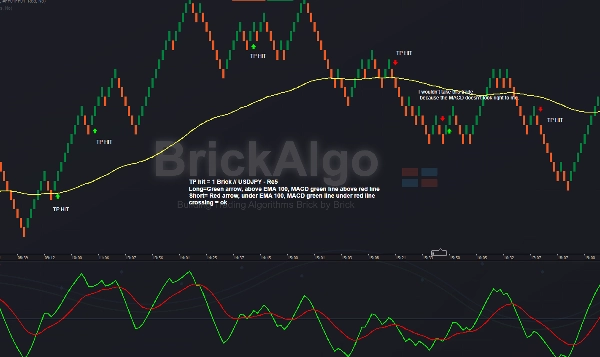
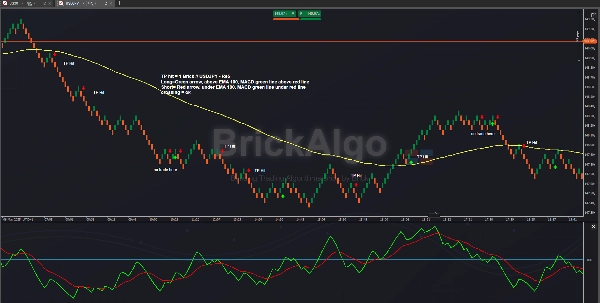
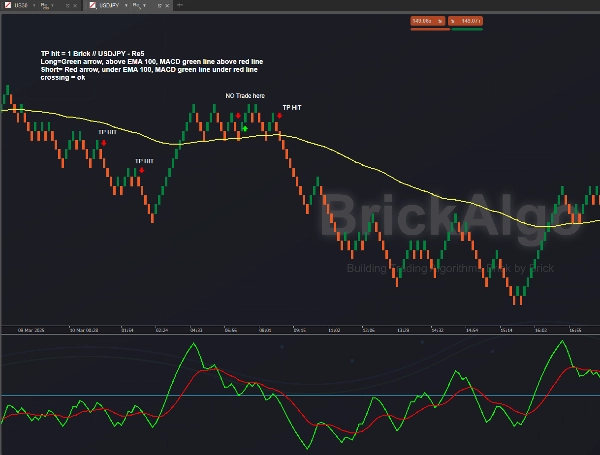
- Renko Grafiği Kullanın (örneğin, Re5): Renko grafiği kullandığınızdan emin olun, örneğin Re5, bu sadece bir örnektir. Gösterge farklı tuğla boyutlarıyla çalışır. Kişisel olarak, USDJPY'yi Re5'te ve US30'u Re100 ve Re200'de bu gösterge ile işlem yapıyorum.
- Ayarları Düzenleyin: Önerilen gösterge ayarları için sağlanan ekran görüntülerine bakın.
- Sinyalleri Filtreleyin: Daha iyi işlem onayı için, ekran görüntülerinde gösterildiği gibi MACD, HTF onayı, Destek & Direnç, EMA veya BrickAlgo TrendPulse gibi diğer BrickAlgo göstergelerini kullanın.
- TP & SL: Kar Al (TP) için 1 tuğla boyutu kullanıyorum, Stop Loss (SL) ise değişkendir, genellikle 1 ile 3 tuğla arasında değişir.
Kişisel olarak USDJPY'yi Re5 grafiğinde işlem yapmayı tercih ederim ve ekran görüntülerinde gösterildiği gibi 100 EMA ve MACD kullanırım. Ek işlemler için BrickAlgo TrendPulse kullanıyorum.


