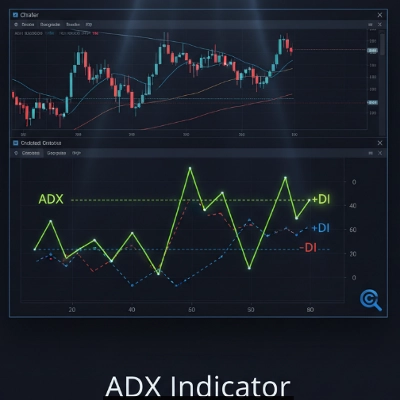
cTrader에서 절대적인 정확도로 추세 강도 파악하기
추세에 역행하는 거래에 지치셨나요? 저희가 소개하는 ADX Indicator Pro는 시장 강도와 방향을 해독하는 궁극의 도구로, cTrader 플랫폼을 위해 맞춤 제작되었습니다.
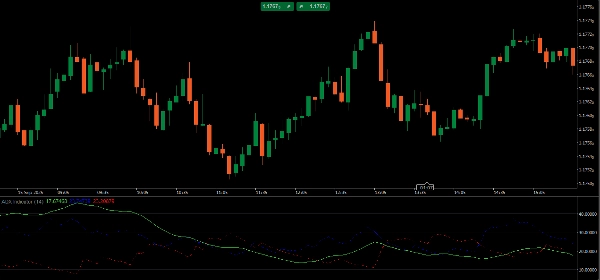
이 지표는 단순히 차트 위의 또 다른 선이 아닙니다. 최적화된 계산과 깔끔한 시각적 디자인을 갖춘 시장 나침반으로, 정확히 필요한 시점에 필요한 정보를 제공합니다.
저희 ADX Indicator와 함께라면, 당신은:
- 추세 이해하기: 시장이 상승 또는 하락 움직임을 위한 강도를 즉시 파악할 수 있습니다.
- 함정 피하기: 횡보장에서는 거래를 중단하고 시간과 돈을 낭비하지 마세요. ADX가 추세가 약할 때를 알려줍니다.
- 자신감 있게 거래하기: ADX 선, +DI, -DI를 통해 더 안전하고 현명한 결정을 내릴 수 있는 완벽한 시각화를 제공합니다.
즉시 사용 가능하며 완벽하고, 당신의 성과에 초점을 맞춘 디자인입니다. 시장 분석을 향상시키고 거래를 통제하세요.
지표 프로필
0.0
리뷰: 0
고객 리뷰
이 상품에 대한 리뷰가 아직 없습니다. 이미 사용해 보셨나요? 다른 사람들에게 가장 먼저 소개해 주세요!
Prop
Forex
Indices
Commodities
Crypto
Stocks
트레이딩 봇, 지표, 플러그인 등 cTrader Store에서 제공되는 상품은 제3자 개발자에 의해 제공되며, 이는 단순히 정보 및 기술적 접근을 목적으로 제공된 것입니다. cTrader Store는 중개인이 아니며, 투자 조언, 개인별 추천 또는 향후 성과에 대한 어떠한 보장도 제공하지 않습니다.
이 작성자의 상품 더 보기


가입일 05/02/2025
30
판매