
설명
설명:
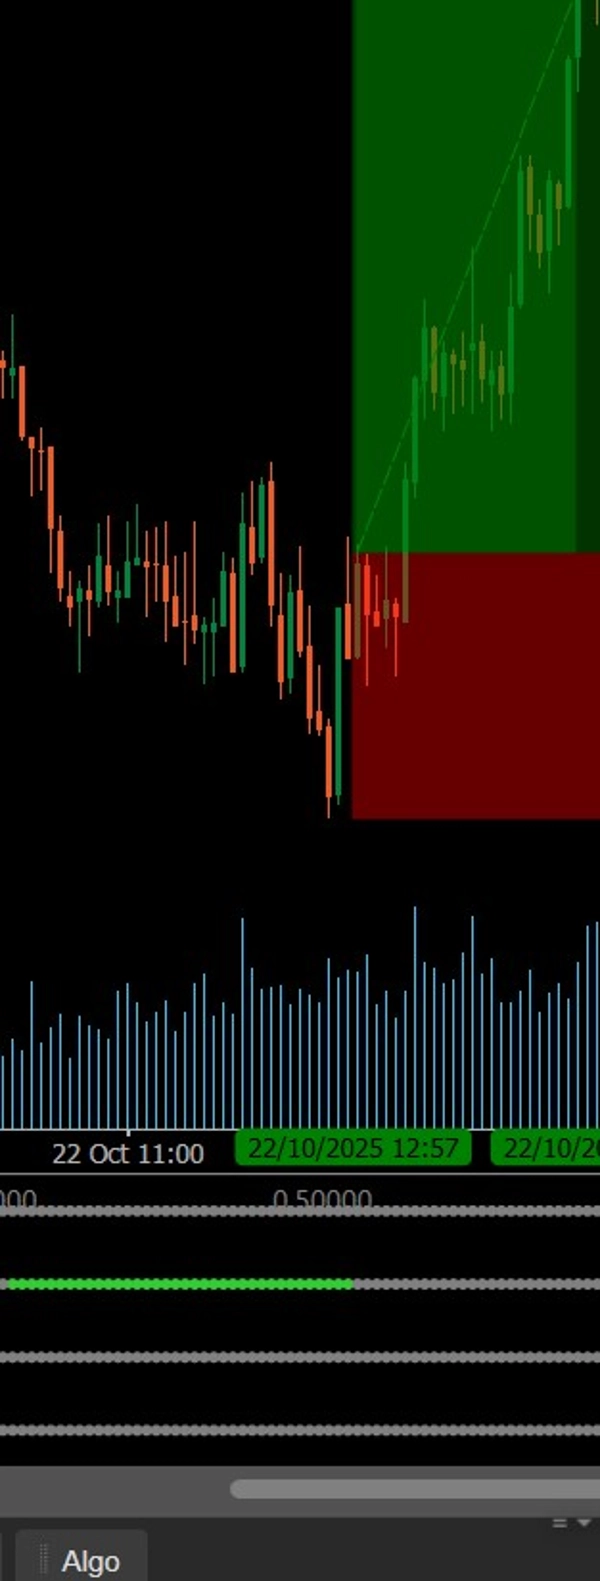
이 지표는 네 가지 사용자 지정 가능한 시간대에 걸친 RSI 추세를 색상으로 구분된 점(과매도는 녹색, 과매수는 빨간색, 중립은 회색)으로 시각화합니다. 이를 통해 트레이더는 시장 모멘텀 정렬을 즉시 평가하고 다중 시간대 RSI 확인을 식별하여 더 강력한 진입을 할 수 있습니다.
요약
지표 프로필
고객 리뷰
4.0
리뷰: 1
5 | 0 % | |
4 | 100 % | |
3 | 0 % | |
2 | 0 % | |
1 | 0 % |
고객 리뷰
November 8, 2025
A few signals across sessions tell more, and the review screen feels calmer.
상담
자주 묻는 질문(FAQ)
BTCUSD
Prop
Forex
Scalping
Indices
EURUSD
Commodities
RSI
Crypto
Stocks
XAUUSD
Martingale
트레이딩 봇, 지표, 플러그인 등 cTrader Store에서 제공되는 상품은 제3자 개발자에 의해 제공되며, 이는 단순히 정보 및 기술적 접근을 목적으로 제공된 것입니다. cTrader Store는 중개인이 아니며, 투자 조언, 개인별 추천 또는 향후 성과에 대한 어떠한 보장도 제공하지 않습니다.
이 작성자의 상품 더 보기


가격
가입일 21/01/2025
3
판매