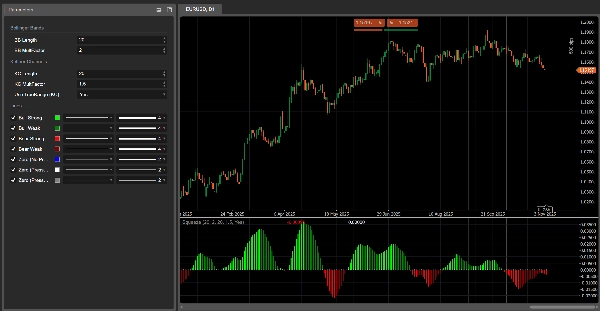
중개인 및 프랍
비즈니스용
00
Days
:
00
Hours
:
00
Minutes
:
00
Seconds
지표
Breakout
Bollinger
Pressure Scanner
23/01/2026
Desktop
가입일 04/03/2025
거래량
40.27M
핍 수익
6.06M
판매
63
무료 설치
3095
"Pressure Scanner" 업로드된 이미지

Pressure Scanner 🔍📊


1. What Pressure Scanner does

Pressure Scanner is a volatility-and-direction tool that:

  • detects when the market is under volatility pressure / compression
  • shows when that pressure is released into expansion 💥
  • measures the direction and strength of the resulting price drive through a scanner value plotted as a histogram.

It combines:

  • a Bollinger-style price band,
  • a Keltner-style volatility channel,
  • and a linear-regression-based scanner line,

to display both pressure states (on / released / neutral) and the directional impulse (up or down).


2. How it works (logic)

  1. Source
    The indicator uses the closing price as the main input.
  2. Outer volatility band (BB-style)
    • Basis = SMA(close, BB Length)
    • Deviation = KC MultFactor × standard deviation of close
    • Upper band = basis + deviation
    • Lower band = basis − deviation
  3. Inner volatility channel (KC-style)
    • Center = SMA(close, KC Length)
    • Range = either True Range or High−Low (set by Use TrueRange)
    • Range average = SMA(range, KC Length)
    • Upper channel = center + rangeAvg × KC MultFactor
    • Lower channel = center − rangeAvg × KC MultFactor
  4. Pressure states
    By comparing the outer band and the inner channel:
    • Pressure ON – black dots at zero
      • Lower band > lower channel and upper band < upper channel
      • The band is fully inside the channel → volatility is compressed, high pressure.
    • Pressure RELEASED – gray dots at zero
      • Lower band < lower channel and upper band > upper channel
      • The band is fully outside the channel → volatility is expanding after pressure.
    • Neutral pressure – blue dots at zero
      • Any other configuration.
  5. Scanner value (val)
    The histogram shows a scanner value computed via linear regression:
    • Over the last KC Length bars, the indicator finds:
      • highest high,
      • lowest low,
      • SMA of close.
    • It builds a dynamic midline:
      • rangeMid = (highest + lowest) / 2
      • combinedMid = average(rangeMid, SMA(close))
    • Then it defines:
      scannerInput=close−combinedMid\text{scannerInput} = \text{close} - \text{combinedMid}scannerInput=close−combinedMid
    • A linear regression over KC Length bars is run on this scannerInput, and the final value at the last bar is the scanner value val.

Interpretation:

  • val > 0 → price is pressing above the midline → bullish pressure
  • val < 0 → price is pressing below the midline → bearish pressure
  • changes in val bar-to-bar → increase or decrease in that directional pressure.


3. How to read the colors

Histogram – directional pressure (scanner value)

Each bar of the histogram corresponds to val and is colored as:

  • Limeval > 0 and rising (val > previous val)
    → strong bullish pressure, scanner value strengthening upward.
  • Greenval > 0 but falling (val ≤ previous val)
    → still bullish, but pressure is fading.
  • Redval < 0 and dropping further (val < previous val)
    → strong bearish pressure, downward drive intensifying.
  • Maroonval < 0 but rising (val ≥ previous val)
    → still bearish, but pressure is losing strength.

So:

  • Above 0 → bullish pressure regime
  • Below 0 → bearish pressure regime
  • Color change on the same side of 0 = pressure accelerating vs slowing.

Zero line – pressure states

Dots plotted at zero show the pressure state:

  • Blue – neutral pressure (normal volatility)
  • BlackPressure ON (compression active)
  • GrayPressure RELEASED (expansion after compression)


4. Parameter reference (English)

BB Length
Period for the SMA and standard deviation used in the outer volatility band.

  • Shorter → more reactive band, more frequent pressure changes.
  • Longer → smoother band, fewer but more “macro” signals.

BB MultFactor
Multiplier for the deviation of the outer band (kept as a user parameter for flexibility).
In this port, the deviation behaviour is tied to KC MultFactor as in the original formula, but you can adapt it if you want a different band style.

KC Length
Period for:

  • the center line of the volatility channel,
  • the range smoothing,
  • the high/low window and the scanner regression.

Defines how far back Pressure Scanner looks to estimate volatility structure and directional pressure.

KC MultFactor
Controls the width of the volatility channel and the outer band.

  • Larger value → wider channel, fewer Pressure ON states.
  • Smaller value → tighter channel, more frequent pressure signals.

Use TrueRange (KC)

  • true → channel range uses True Range (captures gaps and sharp moves).
  • false → range is simply High − Low.


0.0
리뷰: 0
고객 리뷰
이 상품에 대한 리뷰가 아직 없습니다. 이미 사용해 보셨나요? 다른 사람들에게 가장 먼저 소개해 주세요!
이 작성자의 상품 더 보기
지표
NAS100
NZDUSD
Martingale
+26
Volume Delta
Read aggressive flow in real time. Flexible resets (Day/Week/Month), optional EMA smoothing, and non-repainting cumulati
cBot
NAS100
NZDUSD
Martingale
+26
Prop Ready Bot_v.2.0
The Prop-Ready Bot The Definitive Automaton for Challenges 🛡️ V2.0
지표
Grid
NZDUSD
XAUUSD
+16
vWAP Free
Editions: Free (core VWAP + bands) · Pro (multi‑VWAP, click‑to‑anchor, alerts).
cBot
Grid
NAS100
RSI
+20
Breakout Premium Pro v2.0
A price-action-first algorithm to trade Breakout, Approach, and Return around prior High/Low levels—with Prop-style risk
cBot
NAS100
NZDUSD
Martingale
+26
ElliottWaveBot
N.B.: Results with an initial invested capital of 100 euros.
cBot
NAS100
NZDUSD
Martingale
+26
TradeCopierBot
✅ Buy 3 prop accounts and manage just 1: cut management effort by 66% with a professional tool.
지표
NAS100
NZDUSD
Martingale
+26
Volume Bubble
Volume Bubbles is a lightweight yet powerful visual indicator for cTrader
지표
ZigZag
Indices
Breakout
+1
Auto Tools Suite
Auto Trendlines, Fibonacci, Pitchfork and Patterns from non‑repainting pivots. One‑click Presets, targeted Alerts, and a
지표
NAS100
NZDUSD
Martingale
+26
Breakout channel
Breakout Channels automatically detects consolidation ranges and highlights when price breaks out of them.
cBot
NAS100
NZDUSD
Martingale
+26
ElliottWave Pro cBot
The Elliott Wave Pro Bot is a sophisticated and highly configurable algorithmic trading system
지표
NAS100
NZDUSD
XAUUSD
+14
ZIG ZAG Free
ZigZag Free is a clean swing-detection tool that marks significant pivot highs/lows
cBot
Indices
RSI
Forex
+2
US 2000+MACD+ADR+ADMIR+RSI+MANY MORE-TF4M
N.B.: Results with an initial invested capital of 100 euros.
지표
NAS100
NZDUSD
Martingale
+26
Liquidity Shift Indicator
Want a cBot based on this indicator? Contact us!
cBot
NAS100
Indices
XAUUSD
+7
COT Institutional Sentiment Bot
Institutional COT sentiment, automated position trading and full prop-firm style risk control – all in one cBot.
지표
NAS100
NZDUSD
Martingale
+25
Volume Profile Suite trial7D
DEMO VERSION 7 DAYS VolumeProfileSuite is an advanced and flexible Volume Profile indicator for cTrader.
cBot
NAS100
NZDUSD
Martingale
+26
Dynamic Trendline Deluxe Pro Cbot - PROP edition
Major Update Announcement: Advanced Prop Firm Risk Management is Here! 🚀
지표
Grid
NAS100
NZDUSD
+15
EMA UP&DOWN 2025
SectorIndex Dual Moving Average Indicator: Your Market Compass 🧭
cBot
Grid
Indices
Breakout
+7
Scalper Pro PROP
Breakout scalping with prop-firm grade equity control.
좋아하실 만한 다른 항목
지표
NAS100
NZDUSD
XAUUSD
+10
Inside CandlePRO
Inside Candle PRO - Professional Inside Bar Pattern Detector
지표
Grid
NAS100
RSI
+19
Smart Volume Delta
Detects smart money activity using advanced tick volume and price divergence analysis.
Ctreder Smart SMA Indicator
cTreder Smart SMA
지표
NAS100
XAUUSD
FVG
+6
Fair Value Gaps
The Fair Value Gap (FVG) Indicator identifies inefficiencies in price action where an imbalance occurs due to aggressive
지표
Prop
Forex
MM-Symbol Info (Pro)
NEW - PNLs as % - daily, weekly, monthly, or yearly & Spread, Time To Close, PNL Alerts, custom Bid / Ask lines
Daily SD Levels - Indicator
Plots intraday VWAP and dynamic ±1/±2 standard deviation (SD) bands based on current day’s price and volume.
지표
NAS100
NZDUSD
XAUUSD
+11
FBX VWAP
FBX VWAP Anchored — Professional VWAP
지표
Indices
Prop
Stocks
+3
4MA
This indicator consists of 3 moving averages that can be configured to your liking, from the type of moving average....
ZigZagSmartAlert_demo
ZigZag Smart Alert DEMO for cTrader DEMO VERSION 24 hours free trial! This is a DEMO version of the ZigZag Smart Aler
지표
VWAP
VWAP (Volume Weighted Average Price)
Customizable VWAP with flexible reset, three band methods, and full Fibonacci level control.
지표
Grid
NAS100
NZDUSD
+19
Dynamic-Swing-Anchored-Vwap
“Dynamic Swing VWAP — Structure-Anchored, Volatility-Adaptive, Market-Ready.” 🚀
지표
Indices
Signal
Whale Hunting For boom crash
The **Whale Hunting Indicator** is a trading tool for **Boom & Crash and Volatility indices**, featuring **Auto Trend De
지표
NAS100
XAUUSD
Forex
+5
Market Sessions Pre
The Market Sessions indicator is a popular tool for visually representing global trading sessions on a price chart.
지표
NAS100
NZDUSD
RSI
+11
RSI Channel Trigger
🧠Visually marks momentum zones when the RSI crosses the overbought/oversold thresholds (default 70/30). ✅
지표
Indices
Stocks
Commodities
+2
Price-Time Filtering
Trend filter based on Alfred François Tagher's price-time methodology. Identifies trends when close breaks prior period'
지표
RSI
XAUUSD
ATR
+3
RSI NextGen
The RSI NextGen is an advanced and modernized version of the classic Relative Strength Index (RSI)
Block Order Rreversal
Order BlockIndicator reversal
Area of Interest
Area of Interest with the power of AI to detect the market interest.