
설명
다이나믹 트렌드 플럭스
유형: 모멘텀 / 트렌드 오실레이터 (MACD 스타일, 다중 색상)
기능
다이나믹 트렌드 플럭스는 컬러 모멘텀 오실레이터로, 고전적인 빠른/느린 EMA 차이와 신호선에 기반합니다.
한눈에 다음을 확인할 수 있도록 도와줍니다:
- 언제 모멘텀이 강세인지 약세인지,
- 모멘텀이 강화되고 있는지 약화되고 있는지,
- 그리고 트렌드 전환이 발생하는 위치(주선과 신호선의 교차점).
지표는 다음을 그립니다:
- 주선 (플럭스 선)
-
- 빠른 EMA와 느린 EMA의 차이로 구성됨
- 신호선보다 위에 있는지 아래에 있는지에 따라 색상이 변경됨(선택 사항).
- 신호선
-
- 주선의 이동 평균으로, 더 부드러운 트리거로 사용됨.
- 4가지 색상의 히스토그램 (선택 사항)
-
- 주선과 신호선 간의 거리를 표시함,
- 색상은 방향(0 위/아래)과 세기 변화를 막대별로 인코딩함.
- 교차점에 점 표시 (선택 사항)
-
- 주선이 신호선을 교차하는 위치를 강조 표시 → 잠재적 트렌드 단계 변화.
모든 계산은 현재 차트 시간대에서 수행됩니다.
읽는 방법
1. 제로 라인
- 값이 제로 이상 → 강세 압력이 우세함.
- 값이 제로 이하 → 약세 압력이 우세함.
2. 컬러 히스토그램
4색 모드 ON 시:
- 아쿠아 → 0 이상이며 상승 중
-
- 강한 / 증가하는 강세 모멘텀.
- 파랑 → 0 이상이지만 하락 중
-
- 강세 추세는 유지되지만 모멘텀이 둔화됨.
- 빨강 → 0 이하이며 하락 중
-
- 강한 / 증가하는 약세 모멘텀.
- 마룬 → 0 이하이지만 상승 중
-
- 약세 단계는 유지되지만 모멘텀이 약화됨.
이로 인해 다이버전스와 모멘텀 변화를 시각적으로 훨씬 쉽게 파악할 수 있습니다.
3. 주선 및 신호선
- 주선이 신호선 위 → 강세 단계.
- 주선이 신호선 아래 → 약세 단계.
색상 변경이 활성화된 경우:
- 주선 라임색 = 신호선 위 (강세 제어)
- 주선 빨강색 = 신호선 아래 (약세 제어)
4. 교차점 점 표시
- 녹색 점 (상향 교차) → 주선이 신호선 위로 교차함
-
- 강세 스윙의 시작 가능성.
- 빨간 점 (하향 교차) → 주선이 신호선 아래로 교차함
-
- 약세 스윙의 시작 가능성.
이 신호들은 항상 구조 / 가격 움직임 및 상위 시간대 컨텍스트와 함께 사용하세요.
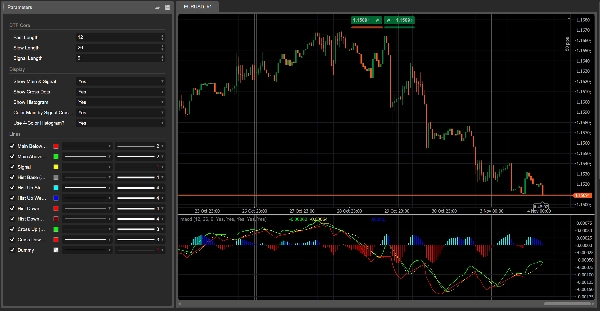
매개변수 (영어)
DTF 코어
- 빠른 길이 – 빠른 EMA 기간 (기본값 12).
- 느린 길이 – 느린 EMA 기간 (기본값 26).
- 신호 길이 – 주선에 적용되는 신호 SMA 기간 (기본값 9).
디스플레이
- 주선 및 신호선 표시 – 두 선을 토글합니다.
- 교차점 점 표시 – 주선/신호선 교차점에 점을 표시합니다.
- 히스토그램 표시 – 배경 히스토그램을 토글합니다.
- 신호 교차에 따른 주선 색상 변경?
-
- ON → 주선이 라임색으로 신호선 위에 있고, 빨강색으로 아래에 있음.
- OFF → 주선은 계속 빨강색임.
- 4색 히스토그램 사용?
-
- ON → 아쿠아 / 파랑 / 빨강 / 마룬 논리.
- OFF → 히스토그램은 단일 회색 색상임.
요약
지표 프로필
고객 리뷰
4.0
리뷰: 1
5 | 0 % | |
4 | 100 % | |
3 | 0 % | |
2 | 0 % | |
1 | 0 % |
상담
자주 묻는 질문(FAQ)
Signal
Indices
Commodities
GBPUSD
RSI
Bollinger
Fibonacci
Scalping
AI
XAUUSD
NAS100
MACD
BTCUSD
Forex
Breakout
EURUSD
NZDUSD
Martingale
Prop
ZigZag
Supertrend
Fair Value Gap
SMC
Crypto
Grid
Stocks
ATR
USDJPY
VWAP
트레이딩 봇, 지표, 플러그인 등 cTrader Store에서 제공되는 상품은 제3자 개발자에 의해 제공되며, 이는 단순히 정보 및 기술적 접근을 목적으로 제공된 것입니다. cTrader Store는 중개인이 아니며, 투자 조언, 개인별 추천 또는 향후 성과에 대한 어떠한 보장도 제공하지 않습니다.


가격
42.11M
거래량
6.13M
핍 수익
222
판매
8.38K
무료 설치