
설명
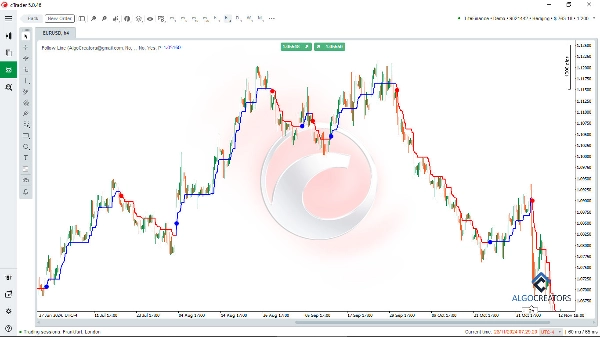
The Follow Line indicator 은 기술적 분석을 위한 강력한 cTrader 지표로, 트레이더가 금융 시장에서 최적의 진입 및 청산 시점을 식별하는 데 도움을 줍니다. 볼린저 밴드와 ATR 지표를 결합하여 추세를 필터링하고 신뢰할 수 있는 매수 및 매도 신호를 제공합니다.
이 지표를 사용하면 상승 또는 하락 시장 추세를 쉽게 파악하고 신뢰도가 높은 신호를 따를 수 있습니다.
트레이더는 Follow Line Indicator를 cTrader의 Smart Money Assistant indicator 및 MACD와 같은 오실레이터와 결합하여 분석을 강화하고 거래 진입을 확인할 수 있습니다.
사용자 정의 가능한 설정과 실시간 알림 기능으로 모든 거래 전략에 가치 있는 추가 요소가 되어, 사용자가 자신감과 정확성을 가지고 성공적인 거래를 실행할 수 있게 합니다.
주요 특징:
- 추세 감지: Follow Line을 사용하여 강세 또는 약세 시장 추세를 식별합니다.
- 매수/매도 신호: 볼린저 밴드 돌파를 기반으로 정확한 매수 및 매도 신호를 표시합니다.
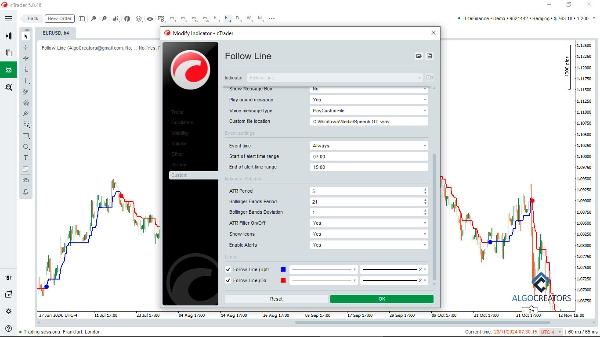
- ATR 필터: 신호 정확도를 높이기 위해 ATR 필터를 활성화하거나 비활성화할 수 있는 옵션.
- 사용자 정의 설정: 볼린저 밴드 기간, 표준 편차 및 ATR 기간을 조정할 수 있습니다.
- 시각적 표현: 직관적인 아이콘(화살표 또는 선)을 사용하여 차트에 신호를 표시합니다.
- 알림: 매수 또는 매도 신호가 나타날 때 즉시 알림을 받습니다.
이 지표는 매우 사용자 정의가 가능하여 트레이더가 자신의 전략에 맞게 볼린저 밴드 기간, 표준 편차 및 ATR 설정을 조정할 수 있습니다. 시각적 신호와 즉각적인 알림 기능으로 스캘핑과 스윙 트레이딩 모두에 사용자 친화적이고 효과적입니다. 추세 감지, 위험 관리 및 사용자 정의 설정과 같은 기능을 갖춘 Follow Line Indicator는 외환, 암호화폐 및 주식 트레이더가 기술적 분석과 거래 성과를 향상시키는 데 이상적입니다.
정확한 시장 기회를 식별하는 데 완벽합니다!
요약
AI 요약
The Follow Line indicator is a technical analysis tool for the cTrader platform designed to identify market trends and generate accurate buy and sell signals. It combines Bollinger Bands and the Average True Range (ATR) indicator to filter trends and enhance signal reliability. Key features include trend detection for bullish and bearish markets, buy/sell signals based on Bollinger Bands breakouts, and an optional ATR filter to improve signal accuracy.
Users can customize settings such as Bollinger Bands period, standard deviation, and ATR period to align with their trading strategies. The indicator visually represents signals on the chart using intuitive icons like arrows or lines and provides real-time alerts when signals occur. It supports various trading styles, including scalping and swing trading, and is suitable for forex, cryptocurrency, and stock markets.
The Follow Line indicator can be combined with other tools like the cTrader Smart Money Assistant and MACD oscillators to confirm trade entries and enhance analysis. Its customizable features and alert system assist traders in identifying precise market opportunities and managing risk effectively.
지표 프로필
고객 리뷰
4.4
리뷰: 5
5 | 60 % | |
4 | 20 % | |
3 | 20 % | |
2 | 0 % | |
1 | 0 % |
고객 리뷰
July 2, 2026
100% Best indicator...but in settings there should be an option to change the size of the bubble and colour of the bubbles also....
October 5, 2025
August 26, 2025
July 9, 2025
Pros: Combines Bollinger Bands and ATR for clear trend-following lines. Simple setup, stable on all assets, minimal system load. Effective for trend traders. Cons: Lacks advanced filtering (e.g., by volume), no flexible alert settings or manual level adjustment.
상담
자주 묻는 질문(FAQ)
Forex
Signal
Scalping
Crypto
ATR
MACD
Bollinger
트레이딩 봇, 지표, 플러그인 등 cTrader Store에서 제공되는 상품은 제3자 개발자에 의해 제공되며, 이는 단순히 정보 및 기술적 접근을 목적으로 제공된 것입니다. cTrader Store는 중개인이 아니며, 투자 조언, 개인별 추천 또는 향후 성과에 대한 어떠한 보장도 제공하지 않습니다.
이 작성자의 상품 더 보기


가격
8.32K
무료 설치