설명
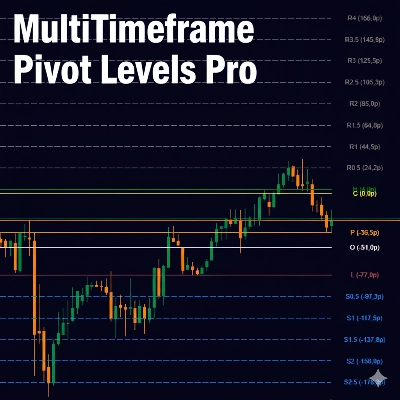
MultiTimeframe Pivot Levels Pro 는 상위 타임프레임의 피벗 포인트와 지지/저항 수준을 현재 차트에 직접 표시하는 고급 트레이딩 지표입니다. 이 강력한 도구는 트레이더가 전략적 진입 및 청산 지점을 위한 주요 가격 수준을 식별하는 데 도움을 줍니다.
주요 특징:
- 다중 타임프레임 분석 (어떤 차트에서든 일간, 주간, 월간 피벗 표시)
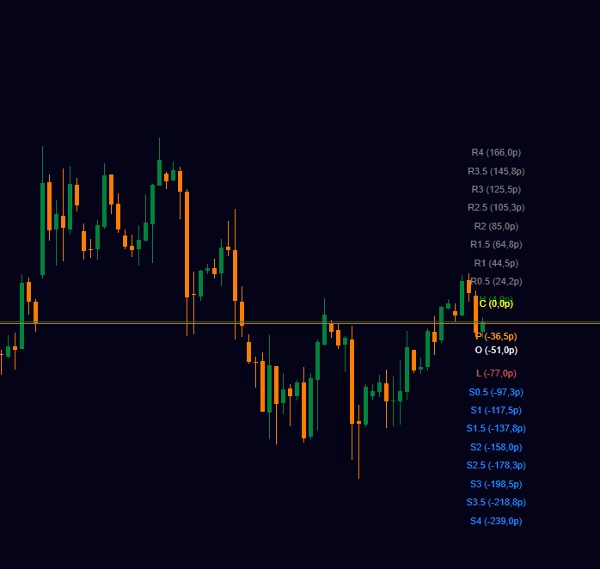
- 포괄적인 시장 구조를 위한 8개의 지지 및 8개의 저항 수준
- 두 가지 피벗 계산 방법 (클래식: H+L/2, 표준: H+L+C/3)
- 모든 수준에 대해 사용자 지정 가능한 색상 및 가시성
- 현재 가격으로부터의 핍 단위 거리 표시
- 원활한 작동을 위한 최적화된 성능
- 깔끔하고 전문적인 시각적 표현
적합 대상:
- 다중 타임프레임을 사용하는 스윙 트레이더
- 주요 참조 수준이 필요한 데이 트레이더
- 지지/저항을 식별하는 가격 행동 트레이더
- 정확한 수준 기반 거래를 추구하는 모든 거래 스타일
요약
지표 프로필
고객 리뷰
0.0
리뷰: 0
고객 리뷰
이 상품에 대한 리뷰가 아직 없습니다. 이미 사용해 보셨나요? 다른 사람들에게 가장 먼저 소개해 주세요!
상담
자주 묻는 질문(FAQ)
BTCUSD
Forex
Indices
EURUSD
Commodities
GBPUSD
NZDUSD
Crypto
Stocks
XAUUSD
NAS100
USDJPY
트레이딩 봇, 지표, 플러그인 등 cTrader Store에서 제공되는 상품은 제3자 개발자에 의해 제공되며, 이는 단순히 정보 및 기술적 접근을 목적으로 제공된 것입니다. cTrader Store는 중개인이 아니며, 투자 조언, 개인별 추천 또는 향후 성과에 대한 어떠한 보장도 제공하지 않습니다.
이 작성자의 상품 더 보기


좋아하실 만한 다른 항목


가격
가입일 28/12/2024
54
무료 설치