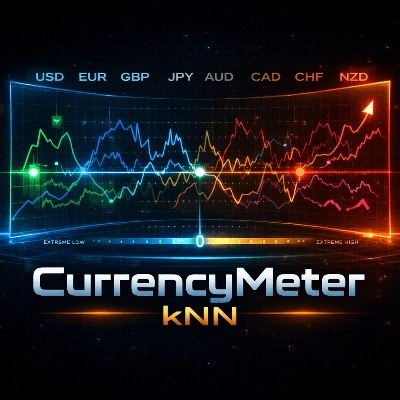
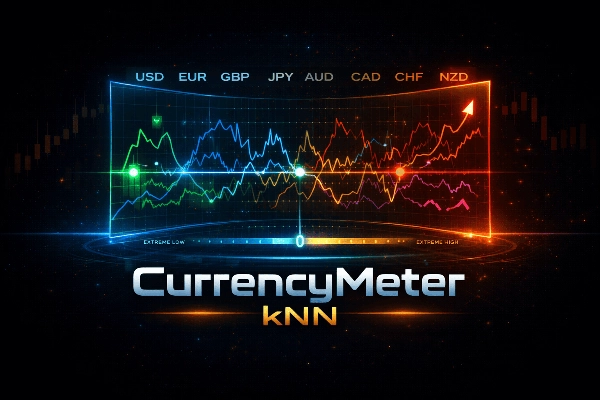
Currency Meter KNN
지표
버전 2.0, Jan 2026
Windows, Mac
설명
CurrencyMeter kNN은 통화 흐름을 명확하게 보고자 하는 트레이더를 위해 만들어진 다중 통화 강도 측정기이며, 평균 회귀 확률을 추정하는 간단한 머신러닝 계층을 포함하고 있습니다.
고전적인 지표와 달리, 8대 주요 통화(USD, EUR, GBP, JPY, AUD, CAD, CHF, NZD)의 강도를 모든 통화쌍의 정보를 집계하여 계산한 후, 이를 컴팩트한 미터로 정규화합니다. 여러 롤링 기간 동안의 % 수익률과 비밀로 유지되는 5가지 다른 맞춤형 특성들을 사용합니다.
작동 원리:
- 다중 통화쌍 집계: 각 통화에 대해 미터는 여러 겹치는 롤링 윈도우 특성을 집계합니다. 이를 통해 각 통화별 평균화된 “통화 압력” 값을 산출합니다.
- 동적 임계값을 이용한 극단값 탐지: 시장은 비정상적입니다. 가격/수익률의 통계적 특성은 시간에 따라 변합니다(변동성, 유동성, 거시 주기, 세션). 고정 임계값은 한 체제에서 “극단적”인 것이 다른 체제에서는 작동하지 않기 때문에 종종 실패합니다.
이 불안정성을 줄이기 위해 모델은 미터의 최근 분포에서 계산된 동적 임계값을 사용합니다. “극단적”인 값을 최근 절대값의 상위 꼬리(백분위 기반)로 추정합니다. 이는 원시 신호를 보다 정상적인 행동에 가깝게 변환하여 kNN이 모델링하고 학습하기 쉽게 만듭니다.
- 간단한 kNN 모델(투명한 ML): k-최근접 이웃(kNN) 분류기를 사용하여 극단적 조건이 정의된 기간 내에 되돌아가는 경향이 있는지 추정합니다.
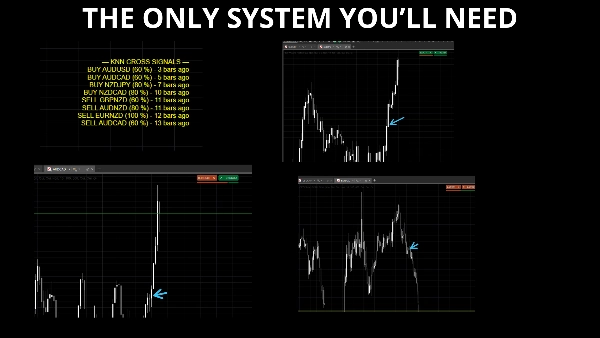
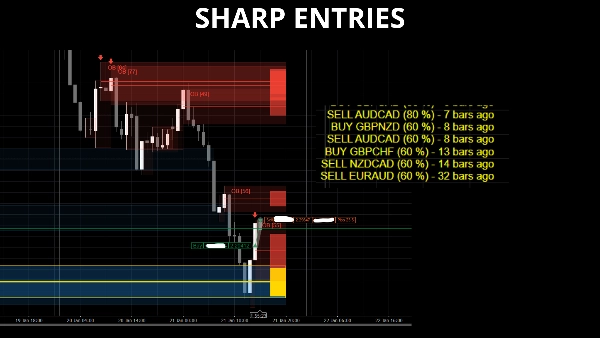
확신 임계값을 초과하면 지표는 방향성 알림을 출력합니다: X/Y 매수 또는 X/Y 매도.
특징:
- 한 패널에 표시된 8대 주요 통화
- 다중 통화쌍 집계
- 최근 분포를 기반으로 한 동적 “극단적” 임계값
- 평균 회귀 편향을 위한 kNN 확률 계층
- 최근 신호를 위한 지속적인 패널 내 화살표
참고:
- 의도적으로 간단하고 투명한 ML 접근법(kNN)입니다. 블랙박스가 아닙니다.
- 목표는 “예측”(소매 트레이더에게는 본질적으로 불가능함)이 아니라 반응입니다: 통화가 최근 행동에 비해 통계적으로 과도하게 확장되었을 때를 식별하는 것입니다.
요약
지표 프로필
고객 리뷰
0.0
리뷰: 0
고객 리뷰
이 상품에 대한 리뷰가 아직 없습니다. 이미 사용해 보셨나요? 다른 사람들에게 가장 먼저 소개해 주세요!
상담
자주 묻는 질문(FAQ)
Forex
Signal
Scalping
EURUSD
GBPUSD
NZDUSD
SMC
AI
USDJPY
트레이딩 봇, 지표, 플러그인 등 cTrader Store에서 제공되는 상품은 제3자 개발자에 의해 제공되며, 이는 단순히 정보 및 기술적 접근을 목적으로 제공된 것입니다. cTrader Store는 중개인이 아니며, 투자 조언, 개인별 추천 또는 향후 성과에 대한 어떠한 보장도 제공하지 않습니다.


가격
가입일 23/07/2025
6.91M
거래량
27.63K
핍 수익
877
무료 설치