
Açıklama
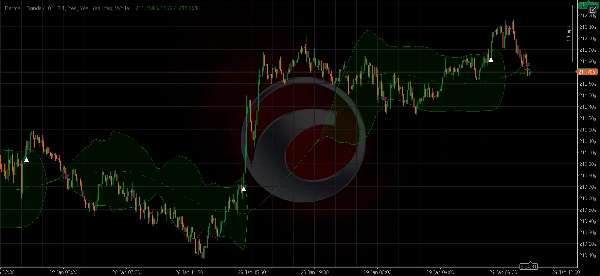
Bermaui Bands (BB), fiyat hareketlerinin yatay mı yoksa trend halinde mi olduğunu ayırt etmeye yardımcı olan teknik bir analiz aracıdır. Bu göstergenin arkasındaki fikir şu adımlarla açıklanabilir -
- 0 ile 100 arasında hareket eden bir osilatör olarak Standart Sapmayı hesaplayın. Buna Bermaui Sapma yüzdesi (BD yüzdesi) adını vereceğiz.
- Eğer "BD yüzdesi" sıfıra yakınsa, volatilite aşırı düzeydedir. Ayrıca, "BD yüzdesi" 100'e yakınsa volatilite çok düşüktür.
- Yüksek volatilite, trend olan bir piyasa için büyük bir olasılık anlamına gelirken, düşük volatilite yanlamasına veya yatay piyasa anlamına gelir.
- Orta Hat, Standart Sapmanın Hareketli Ortalama'ya bağlı olarak hesaplandığı için Basit Hareketli Ortalama'dır.
- Üst Bermaui Bandını elde etmek için hesaplamadaki aynı bar sayısına sahip basit hareketli ortalamaya "BD yüzdesi" ekleyin.
- Alt Bermaui Bandını elde etmek için hesaplamadaki aynı bar sayısına sahip basit hareketli ortalamadan "BD yüzdesi" çıkarın.
Özet
Gösterge profili
Müşteri değerlendirmeleri
0.0
Değerlendirmeler: 0
Müşteri değerlendirmeleri
Bu ürün için henüz bir değerlendirme yok. Ürünü denediniz mi? O zaman ona dair görüşlerini paylaşan ilk kişi olun!
Tartışma
SSS
Forex
Signal
Breakout
Indices
Commodities
Crypto
Stocks
cTrader Store üzerinden erişilebilen işlem botları, göstergeler ve eklentiler gibi ürünler, üçüncü taraf sağlayıcılar tarafından sağlanır ve yalnızca bilgilendirme ve teknik erişim amaçlarıyla sunulur. cTrader Store bir broker değildir ve yatırım tavsiyesi, kişisel öneriler vermez veya gelecekteki performansı garanti etmez.


Fiyat
Başlangıç 28/01/2026