설명
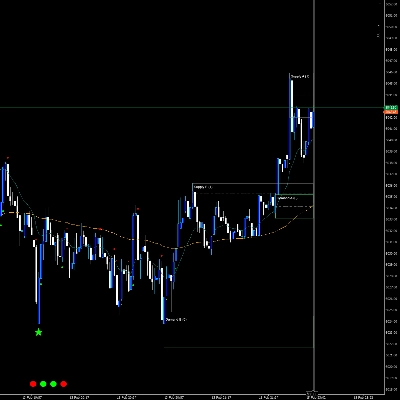
cTrader용 컴팩트 스캘핑 지표로, 세 가지 요소를 하나의 깔끔한 오버레이에 결합했습니다: 세션 기반 일일 VWAP, 개장 범위 가이드, 모멘텀/활동 표시기로서의 “델타/파워” 버블, 그리고 테스트/확인 상태가 포함된 동적 공급/수요 구역과 선택적 추세 필터. 이 외에도, 여러 시간대에서 가장 최근에 닫힌 캔들의 방향을 한눈에 보여주는 다중 시간대 신호등(VWAP + 개장 범위)을 포함합니다.
참고: 매개변수는 도구를 시장/시간대에 빠르게 적응시킬 수 있도록 의도적으로 설계되었으며, 논리는 백그라운드에서 자동으로 실행됩니다.
제공 기능
- 일일 VWAP(매 거래일 초기화): 공정한 “세션 가격”을 시각화하여 평균 회귀, 되돌림, 방향성 편향에 도움을 줍니다
- 개장 범위(OR) 고가/저가: 개장 범위를 그려 돌파/반전 설정을 구조화할 수 있습니다(자동 또는 수동으로 정의된 분 단위)
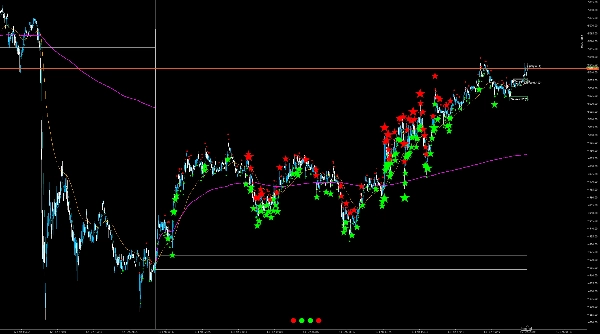
- 델타/파워 버블: 평균 이상의 활동이 있는 캔들을 강조 표시(모드에 따라: 거래량 급증, 범위/몸통-거래량, 또는 델타 대리)하고 방향(강세/약세)에 따라 색상을 지정합니다
- 공급/수요 구역(두 개의 피벗 세트 A/B): 확인된 피벗 고점/저점에서 자동으로 생성된 구역, ATR 기반 구역 깊이, 정의된 우측 확장 및 선택적 중간선 포함
- 구역 상태: “신선 → 테스트됨 → 확인됨”(확인은 선택적으로 거래량 조건을 통해)으로 구역이 이미 거래되었는지, 강한 반응이 있었는지 즉시 확인할 수 있습니다
- 추세 필터(선택 사항): EMA 또는 EMA+ADX 필터로 구역이 추세 방향에 맞게 표시/고려됩니다(예: 상승 추세에서만 수요 구역 표시)
- 다중 시간대 신호등: 마지막으로 닫힌 캔들에 따라 M1/M5/H1/D1을 녹색/빨강/회색으로 표시—차트 시간대를 전환하지 않고도 유용한 컨텍스트 제공
구매자가 설정할 수 있는 항목(매개변수 개요)
설정은 그룹화되어 있으며 의도적으로 실용적입니다:
핵심
- ATR 길이: 구역 깊이 및 일부 버블 지표의 기본 입력값
- 일일 VWAP 표시: 켜기/끄기
- 개장 범위 표시: 켜기/끄기
- OR 모드: 자동(차트 시간대에 따라 다름) 또는 수동(고정 분 단위)
- OR 자동 계수 / OR 분: OR 기간 미세 조정
추세 필터
- 모드: 끄기 / EMA / EMA+ADX
- EMA 빠름 / EMA 느림: EMA 교차/관계를 통한 추세 방향
- ADX 길이 + 임계값: EMA+ADX가 활성화될 때 최소 추세 강도
- EMA 선 그리기: 차트에 필터 EMA를 선택적으로 표시
버블
- 버블 표시: 켜기/끄기
- 델타 대리: 세 가지 변형(범위 가중, 종가 대 이전, 종가 대 시가)으로 도구/피드에 따라 다름
- 버블 지표: 자동 또는 고정 지표(절대 델타, 거래량 급증, 몸통/범위 거래량)
- 분위수 회고 + 분위수 %: 버블 신호의 “희귀성” 조절(높은 % = 더 강한 이벤트만)
- 라벨 제한: 차트에 남아 있는 버블 라벨 수(성능/명확성)
- 기본 글꼴 + 4K 모드: 고해상도 디스플레이용 시각적 크기 조정
- 글리프 작음/큼: 버블 모양(점/원 등)
- 디버그: 버블 강제 표시(테스트 전용)
구역
- 구역 표시: 켜기/끄기
- 구역 깊이 × ATR: 구역 두께(변동성 적응형)
- 확장(바): 구역이 오른쪽으로 확장되는 거리
- 중간선 표시: 켜기/끄기
- 추세 내 구역만: 추세 필터 방향과 일치할 때만 구역 표시
- 피벗 매개변수 A & B(좌/우): 두 가지 민감도(예: “거친” + “미세” 구역)
- 구역 라벨 크기: 작음/중간/큼
- 색상(ARGB): 공급/수요, 테스트됨, 확인됨 + 중간선에 대한 별도 색상
- 거래량 + 거래량 MA/배수로 확인: 틱 거래량이 MA × 계수 이상일 때만 확인
신호등
- 신호등 표시: 켜기/끄기
- 글꼴 + 4K 크기 조정: 크기/가독성
- N 바마다 업데이트: 업데이트 빈도(성능 대 반응성)
(매개변수 필드 설명은 Parameter 속성/설명을 통해 깔끔하게 제시할 수 있으며, 플랫폼은 매개변수 UI 내에서 그룹화 및 설명을 직접 지원합니다.)
대상 사용자
- 빠른 컨텍스트가 필요한 스캘퍼 및 일중 거래자: 구조를 위한 VWAP/OR, “활동”을 위한 버블, 반응 영역을 위한 구역
- 여러 지표를 쌓지 않고 명확한 시각화를 원하는 거래자
- 핵심을 플러그 앤 플레이 디스플레이로 유지하면서 선택적 추세 필터(EMA/ADX) 뷰를 원하는 사용자
일반적인 사용법(간단하고 실용적)
VWAP + 신호등으로 편향을 확인하고, 개장 단계 동안 OR을 “전투 구역”으로 사용하세요.
버블을 “평균 이상 무언가가 일어나고 있다”(돌파, 흡수, 충격)의 단서로 사용하세요.
구역을 계획 영역으로 사용하세요: 첫 터치는 “테스트됨”; 높은 거래량과 함께 반응하면 “확인됨”으로 표시할 수 있습니다; 중간선은 깔끔한 레벨 간 거래에 도움을 줍니다.
요약
지표 프로필
고객 리뷰
0.0
리뷰: 0
고객 리뷰
이 상품에 대한 리뷰가 아직 없습니다. 이미 사용해 보셨나요? 다른 사람들에게 가장 먼저 소개해 주세요!
상담
자주 묻는 질문(FAQ)
Prop
Forex
Signal
Breakout
Scalping
Indices
Commodities
Crypto
Stocks
트레이딩 봇, 지표, 플러그인 등 cTrader Store에서 제공되는 상품은 제3자 개발자에 의해 제공되며, 이는 단순히 정보 및 기술적 접근을 목적으로 제공된 것입니다. cTrader Store는 중개인이 아니며, 투자 조언, 개인별 추천 또는 향후 성과에 대한 어떠한 보장도 제공하지 않습니다.
이 작성자의 상품 더 보기

좋아하실 만한 다른 항목


!["Wyckoff Toolkit [Iridio Capital]" 로고](https://cdn.ctrader.com/image/webp/8acfe6a1-6a8e-4578-9367-9df3af2b1801_27763)


가격
가입일 10/01/2026
6
판매