
설명
고래 유동성 및 흡수 프로필
기관 자금을 추적하고, 주문 흐름을 분석하며, 체적 정밀도로 반전 구역을 포착하세요
이 고래 유동성 및 흡수 프로필은 전통적인 볼륨 프로필이 아닙니다. 이는 모든 거래를 분해하여 볼륨이 어디에서 거래되었는지뿐만 아니라 누가 거래했는지(기관 대 소매)와 어떻게 가격이 해당 수준에서 상호작용했는지(공격성 대 흡수)를 보여주는 시장 미시구조 분석 도구입니다.
최적화된 렌더링 엔진을 특징으로 하여 모든 데이터를 현재 가격 오른쪽에 투사하여 차트를 완전히 깔끔하고 지연 없이 유지합니다.
주요 기능
- 강도 필터 (고래 전용): 백분위 알고리즘(예: 상위 97%)을 사용하여 기관("강한") 볼륨과 소매("약한") 볼륨을 구분합니다. "강한 전용" 모드를 전환하여 스마트 머니의 발자국만 추적할 수 있습니다.
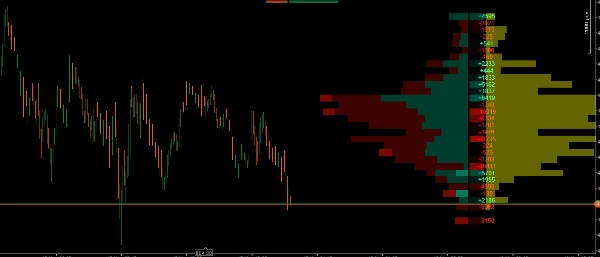
- 중첩 볼륨 프로필: 가격 수준별로 강세 및 약세 볼륨 분포를 시각적으로 표시하여 제어점(POC) 및 고/저 볼륨 노드(HVN/LVN)를 쉽게 식별할 수 있습니다.
- 자동 가치 영역 감지: 가장 높은 비율의 볼륨이 거래된 가격 수준(기본값 70%)을 강조 표시하며, 외부 영역을 희미하게 하여 시장 상황을 한눈에 쉽게 읽을 수 있습니다.
- 델타 프로필 (히트맵): 각 가격 수준에서 시장 매수와 시장 매도의 정확한 차이를 계산합니다. 수치 값과 시각적 히트맵을 포함하여 누가 공격적으로 시장을 장악하고 있는지 빠르게 파악할 수 있습니다.
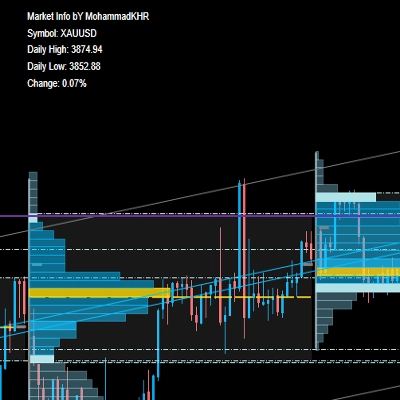
- 흡수 프로필 (노란색 영역): 특히 캔들스틱 윅 내에 갇힌 볼륨을 측정합니다. 이를 통해 스마트 머니가 갇힌 소매 거래자들로부터 유동성을 수동적으로 흡수하는 위치를 그래픽으로 정확히 볼 수 있습니다.
- 최적화된 성능: 무거운 체적 계산은 최신 캔들에만 처리되어 cTrader 플랫폼이 낮은 시간대에서도 원활하고 효율적으로 작동하도록 보장합니다.
이 지표를 거래에 어떻게 사용하나요?
이 지표는 거래에 대한 3단계 확인 레이어를 제공합니다. 효과적으로 결합하는 방법은 다음과 같습니다:
1. 볼륨 프로필 및 가치 영역으로 컨텍스트 정의하기
- 볼륨 프로필을 사용하여 가격 수용이 가장 높은 위치(가치 영역 및 POC)를 식별하세요.
- 전략: 가치 영역 하단(지지선)에서 매수 기회를, 가치 영역 상단(저항선)에서 매도 기회를 찾으세요.
2. 델타 프로필로 공격성 평가하기
- 가격이 주요 수준(예: 지지 구역)에 도달하면 델타 열을 확인하세요.
- 전략: 지지선에서 매수를 원한다면 해당 수준에서 강한 양(녹색) 델타가 나타나 매수자가 적극적으로 개입하고 있음을 보여야 합니다. 델타가 계속해서 강한 음수라면 매도자가 여전히 우세한 상태입니다.
3. 흡수 프로필로 완벽한 트리거 찾기 (지표의 핵심)
- 이 도구가 진정으로 빛나는 부분입니다. 종종 시장이 급락하는 것처럼 보이지만(강한 음수 델타), 가격은 하락을 멈춥니다. 왜일까요? "고래"들이 리밋 주문을 사용하여 모든 매도 압력을 흡수하고 있기 때문입니다.
- 전략 (반전 거래): 가격이 중요한 수준으로 떨어지고 델타가 음수(갇힌 소매 매도자)일 때 갑자기 흡수 프로필에 큰 노란색 막대가 나타나면, 이는 기관이 해당 윅 내 모든 유동성을 흡수했다는 의미입니다. 이것이 반대 방향으로 진입할 최적의 트리거입니다!
4. "강도 필터"를 사용하여 잡음을 제거하세요
- 시장이 횡보하고 방향이 불분명할 때는 "강한 전용" 옵션을 켜세요. 이는 모든 관련 없는 소매 잡음을 숨기고 대규모 자금이 어디에 축적 또는 분배되고 있는지 정확히 보여줍니다.
요약
AI 요약
Whale Liquidity & Absorption Profile is a market microstructure indicator designed for detailed volume and order flow analysis. It distinguishes institutional ("whale") volume from retail activity using a percentile-based Strength Filter, enabling users to focus on smart money footprints. The indicator visually presents a stacked volume profile that separates bullish and bearish volume by price level, highlighting key areas such as the Point of Control (POC) and High/Low Volume Nodes (HVN/LVN). It automatically detects the Value Area, where the majority of volume is concentrated, to provide clear market context.
A Delta Profile heatmap calculates the net difference between market buys and sells at each price level, showing buyer or seller aggression. The Absorption Profile identifies volume trapped in candlestick wicks, revealing where institutional traders absorb liquidity from retail participants. The indicator’s optimized engine processes heavy volumetric calculations only on the latest candle, ensuring smooth performance on the cTrader platform.
Traders can use this tool to define market context, evaluate buying or selling aggression, and pinpoint reversal triggers based on absorption patterns. The "Strong Only" mode filters out retail noise during consolidation phases, focusing on institutional accumulation or distribution zones. This indicator supports volume and DOM data visualization to enhance decision-making around key support and resistance levels.
지표 프로필
지표 카테고리
거래량
출력 유형
시각화
데이터 요구 사항
거래량
DoM
고객 리뷰
5.0
리뷰: 1
5 | 100 % | |
4 | 0 % | |
3 | 0 % | |
2 | 0 % | |
1 | 0 % |
고객 리뷰
May 21, 2026
Thanks for this sir, the delta and volume are depicted cleanly and accurately on this indicator. With the addition of absortion and filter settings for volume, it beats most in its class.
상담
자주 묻는 질문(FAQ)
Key Levels
Volume
Support & Resistance
트레이딩 봇, 지표, 플러그인 등 cTrader Store에서 제공되는 상품은 제3자 개발자에 의해 제공되며, 이는 단순히 정보 및 기술적 접근을 목적으로 제공된 것입니다. cTrader Store는 중개인이 아니며, 투자 조언, 개인별 추천 또는 향후 성과에 대한 어떠한 보장도 제공하지 않습니다.


가격
25
판매
401
무료 설치