Cumulative Delta_noSourceCode
지표
349 다운로드
버전 1.0, Feb 2025
Windows, Mac
설명
요약
AI 요약
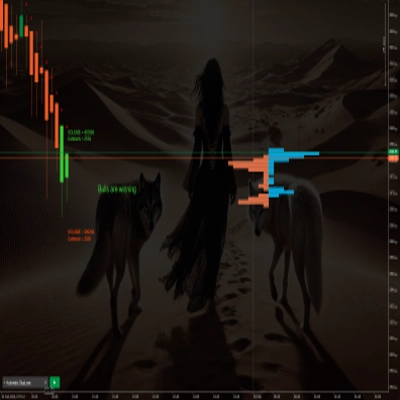
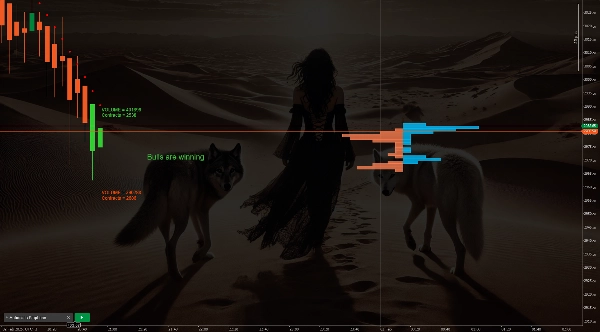
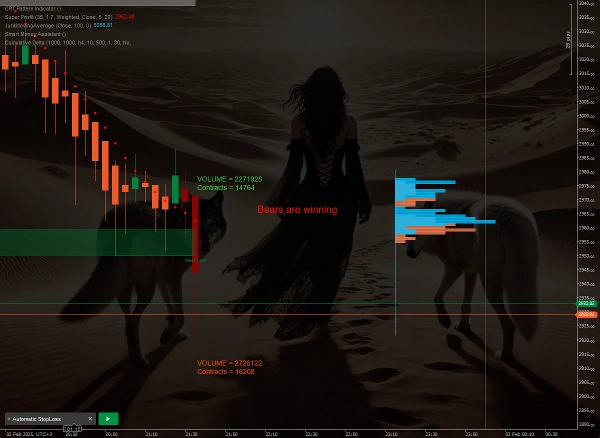
The Cumulative Delta_noSourceCode indicator displays the number of contracts and volume traded per candle on a trading chart. Each candle changes color based on the cumulative delta value for that candle, providing a visual representation of buying and selling pressure. Additionally, the indicator includes a small volume profile for each candle, offering detailed insight into volume distribution within the candle. This tool can help users identify market manipulation patterns by analyzing volume and delta shifts across candles.
지표 프로필
고객 리뷰
0.0
리뷰: 0
고객 리뷰
이 상품에 대한 리뷰가 아직 없습니다. 이미 사용해 보셨나요? 다른 사람들에게 가장 먼저 소개해 주세요!
상담
자주 묻는 질문(FAQ)
트레이딩 봇, 지표, 플러그인 등 cTrader Store에서 제공되는 상품은 제3자 개발자에 의해 제공되며, 이는 단순히 정보 및 기술적 접근을 목적으로 제공된 것입니다. cTrader Store는 중개인이 아니며, 투자 조언, 개인별 추천 또는 향후 성과에 대한 어떠한 보장도 제공하지 않습니다.


!["[Hamster-Coder] Bollinger Bands" 로고](https://cdn.ctrader.com/image/webp/21d8e5d6-fb11-4bac-b9ee-cd05c2b76804_30327)


가격
가입일 09/01/2025
11.78K
무료 설치