
Beschreibung
🔷 Trendlinien Premium Engine
Mehrschichtiger Marktstruktur- & Dynamischer Regressionsindikator
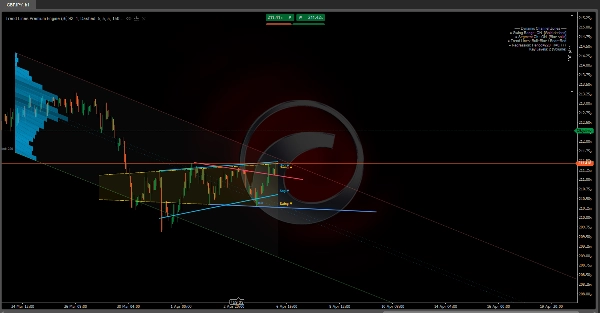
https://chartshots.spotware.com/c/69d3c949a2e08
📌 Was ist das?
Trendlinien Premium Engine ist ein Overlay-Indikator, der 5 unabhängige Module zu einem einzigen Werkzeug kombiniert. Jedes Modul kann ein- oder ausgeschaltet werden. Er bildet Marktstruktur, dynamische Kanäle und volumenbasierte Regressionszonen direkt im Preischart ab.
Er beantwortet drei Kernfragen:
- Wo befindet sich der Preis innerhalb der aktuellen Struktur?
- Was ist der dominierende Trend und wo liegen die Bruchstellen?
- Auf welchen Preisniveaus konzentriert sich die Aktivität?
🧩 Die 5 Module
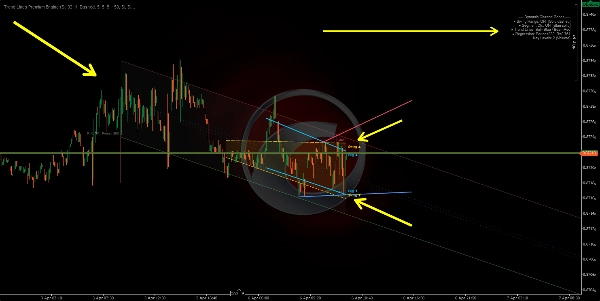
1️⃣ Swing Range Connector
https://chartshots.spotware.com/c/69d3cab9b805b
Erkennt die jüngsten Swing-Hochs und Swing-Tiefs und zeichnet dann einen geneigten Kanal der die ältesten mit den neuesten Punkten auf beiden Seiten verbindet. Der Bereich dazwischen wird als dynamische Range-Zone ausgefüllt.
Funktionsweise:
- Eine Kerze qualifiziert sich als Swing-Punkt, wenn ihr Hoch (oder Tief) im Vergleich zu N Kerzen davor und N Kerzen danach am extremsten ist.
- Eine Gerade wird vom ältesten gespeicherten Swing zum neuesten gezogen und bildet obere und untere Grenzen.
- Der Kanal verschiebt sich automatisch, sobald ein neuer Swing-Punkt bestätigt wird.
Wie man es liest:
- Preis innerhalb des Kanals → definierte strukturelle Range.
- Ausbruch über/unter → Volatilitätserweiterung oder Strukturverschiebung.
- Kanalneigung → vorherrschende Richtungsrichtung der Range.
Parameter
Zweck
Kerzen vor/nach Swing
Anzahl der Kerzen auf jeder Seite, die benötigt werden, um einen Swing zu bestätigen. Höher = bedeutendere Swings
Maximale Swing-Punkte
Wie viele Swings gespeichert werden. Steuert die Kanaltiefe
Historienfenster
Wie weit zurück der Kanal gezeichnet wird
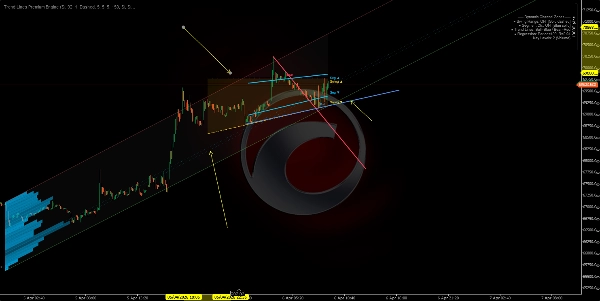
2️⃣ Segment Linear Channel
https://chartshots.spotware.com/c/69d3cb221bba1
Teilt das Analysefenster in 5 gleiche Segmente, findet das höchste Hoch und das niedrigste Tief in jedem und passt dann eine Kleinste-Quadrate-Regressionslinie durch diese 5 oberen Punkte und eine weitere durch die 5 unteren Punkte an.
Funktionsweise:
- Das Fenster wird in 5 Teile geteilt. Pro Teil wird ein repräsentativer Extrempunkt extrahiert.
- Lineare Regression wird über diese 5 Punkte für jede Grenze angewandt.
- Das Ergebnis ist ein Kanal, der sich an die segmentierte Preisstruktur anpasst, statt nur zwei Endpunkten.
Wie man es liest:
- Aufsteigender Kanal → struktureller Aufwärtstrend.
- Absteigender Kanal → struktureller Abwärtstrend.
- Wiederholte Berührungen an einer Grenze → dynamische Unterstützung/Widerstand.
Unterschied zu Modul 1: Swing Range verbindet nur den ersten und letzten Swing. Segment Channel verwendet eine 5-Punkte-Regression, wodurch er glatter und weniger reaktiv auf einen einzelnen Swing ist.
3️⃣ Swing Point Labels
Erkennt Swing-Hochs und -Tiefs und klassifiziert sie in 4 Marktstruktur-Kategorien:
Label
Bedeutung
Zeigt an
HL
Höheres Tief
Bullische Struktur
HH
Höheres Hoch
Bullische Struktur
LH
Niedrigeres Hoch
Bärische Struktur
LL
Niedrigeres Tief
Bärische Struktur
Funktionsweise:
- Jedes neue Swing-Tief wird mit dem vorherigen verglichen. Höher → HL. Niedriger → LL.
- Jedes neue Swing-Hoch wird mit dem vorherigen verglichen. Höher → HH. Niedriger → LH.
Wie man es liest:
- HL + HH Sequenz → Aufwärtstrend intakt.
- LH + LL Sequenz → Abwärtstrend intakt.
- Ein HL, das in ein LL bricht, oder ein LH, das in ein HH bricht → Strukturwechsel (BOS/CHoCH).
Standardmäßig werden nur HL und LH angezeigt, um den Chart übersichtlich zu halten. HH und LL können für vollständige Strukturansicht aktiviert werden.
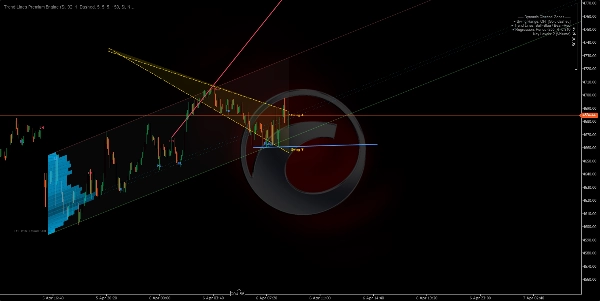
4️⃣ Automatische Trendlinien
https://chartshots.spotware.com/c/69d3cc071272e
Zeichnet Trendlinien, die die zwei jüngsten Swing-Tiefs (bullische Linie) und die zwei jüngsten Swing-Hochs (bärische Linie) verbinden. Die aktive Linie ist hervorgehoben; vorherige Linien verblassen.
Funktionsweise:
- Neues Swing-Tief erkannt → Linie wird vom vorherigen Swing-Tief zum neuen gezogen (bullische Trendlinie).
- Neues Swing-Hoch erkannt → Linie wird vom vorherigen Swing-Hoch zum neuen gezogen (bärische Trendlinie).
- Die Linie wird um eine konfigurierbare Anzahl von Kerzen nach vorne projiziert.
- Wenn eine neue Linie erstellt wird, verblasst die vorherige zu einer halbtransparenten Farbe.
Breakout-Signale (optional): Wenn aktiviert, erkennt der Indikator, ob der Schlusskurs eine aktive Trendlinie kreuzt:
- 🔼 Pfeil nach oben → bullischer Ausbruch.
- 🔽 Pfeil nach unten → bärischer Ausbruch.
Parameter
Zweck
Maximale Linienpaare
Wie viele Linienpaare sichtbar bleiben. Für die sauberste Ansicht auf 1 setzen
Maximale Erweiterungs-Kerzen
Wie weit die Linie nach vorne projiziert wird. Verhindert, dass Linien den gesamten Chart durchqueren
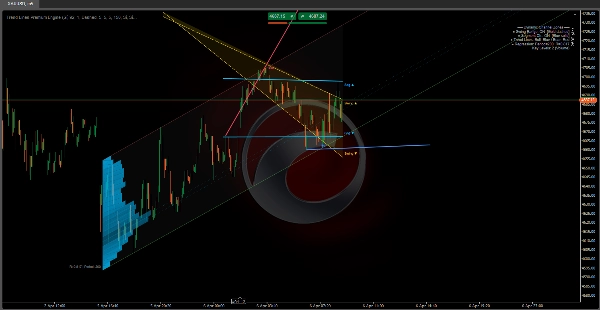
5️⃣ Dynamische Regressionszone
Das fortschrittlichste Modul. Berechnet einen linearen Regressionskanal auf Schlusskursen und überlagert ein Aktivitätsprofil (Histogramm), das zeigt, wo Volumen oder Berührungen innerhalb des Kanals konzentriert sind. Es markiert auch Schlüsselbereiche an den Zonen mit der höchsten Aktivität.
A) Regressionskanal:
- Lineare Regression nach Kleinste-Quadrate wird auf Schlusskurse über einen bestimmten Zeitraum angewandt.
- Standardabweichung der Preise von der Regressionslinie wird berechnet.
- Obere und untere Bänder werden bei N Standardabweichungen vom Zentrum platziert (Standard: 2,0).
- Optional in logarithmischer Skala für bessere Genauigkeit bei hochpreisigen oder hochvolatilen Instrumenten berechnet.
B) Automatische Periodenerkennung:
- Der Algorithmus testet mehrere Perioden (50 bis 400 Kerzen) und berechnet den Pearson-Korrelationskoeffizienten für jede.
- Er wählt die Periode mit der höchsten Korrelation — bei der die lineare Regression am besten zur Preisbewegung passt.
- Der Korrelationswert wird im Chart angezeigt (z.B. R = 0.85).
C) Aktivitätshistogramm:
- Der Kanal wird in horizontale Abschnitte (bis zu 25) unterteilt.
- Für jeden Abschnitt zählt der Algorithmus, wie viele Kerzen dieses Preisniveau berührt haben, gewichtet nach Volumen oder Anzahl der Berührungen (konfigurierbar).
- Abschnitte mit höherer Aktivität erscheinen als längere, undurchsichtigere Balken.
- Dies zeigt den Point of Control (POC) und Hoch-/Niedrig-Aktivitätszonen innerhalb des Kanals.
D) Schlüsselbereiche:
- Die Abschnitte mit der höchsten Aktivität werden als horizontale Linien nach vorne projiziert.
- Sie fungieren als volumenbasierte Unterstützung und Widerstand im Regressionskontext.
Wie man es liest:
- Preis nahe oberem Band → statistisch überkauftes Gebiet.
- Preis nahe unterem Band → statistisch überverkauftes Gebiet.
- R nahe 1 oder -1 → starker, zuverlässiger linearer Trend. R nahe 0 → Seitwärtsbewegung oder Regression ist nicht signifikant.
- Schlüsselbereiche wirken als Preismagnete — Zonen mit historischer Aktivitätskonzentration ziehen den Preis tendenziell zurück.
🎯 Anwendungsfälle
Anwendungsfall
Module
Marktstruktur identifizieren (bullisch/bärisch/Range)
Swing Labels + Trendlinien
Dynamische Unterstützung & Widerstand erkennen
Swing Range + Segment Channel
Wertzonen nach Volumen finden
Regression Zone + Schlüsselbereiche
Strukturbrüche bestätigen
Trendlinien + Breakout-Signale
Trendstärke messen
Pearson-Korrelation (Regression Zone)
⚙️ Empfohlene Einstellungen nach Stil
Stil
Vorgeschlagene Module
Scalping (M1–M15)
Swing Labels + Trendlinien
Intraday (M15–H1)
Alle Module
Swing Trading (H4–D1)
Swing Range + Regression Zone + Schlüsselbereiche
Reine Strukturanalyse
Nur Swing Labels + Trendlinien
⚠️ Wichtige Hinweise
Zusammenfassung
The five modules include:
1. Swing Range Connector: Detects recent swing highs and lows to draw a sloped channel representing the structural range.
2. Segment Linear Channel: Divides the analysis window into five segments, fitting regression lines through highs and lows for a smoother channel.
3. Swing Point Labels: Classifies swing highs and lows into four market structure categories (Higher High, Higher Low, Lower High, Lower Low) to indicate bullish or bearish trends and structure shifts.
4. Automatic Trend Lines: Connects the two most recent swing highs and lows with trend lines, highlighting active lines and optionally signaling breakouts.
5. Dynamic Regression Zone: Calculates a linear regression channel on closing prices with an activity histogram showing volume or touch concentration, marking key volume-based support and resistance levels.
The indicator supports various trading styles, recommending specific module combinations for scalping, intraday, swing trading, and pure structure analysis. It requires price bars and volume data and provides visualizations and signals including breakout, trend strength, and level touches or breaks.


