present
Registrati e ricevi uno sconto da $50 sul tuo primo acquisto
Trading product for Monthly Return Table Indicatore Drawdown Monitor, image 1
Monthly Return Table
Indicatore
Versione 1.0, Jul 2026
Windows, Mac
Trading product for Monthly Return Table Indicatore Drawdown Monitor, image 2
Trading product for Monthly Return Table Indicatore Drawdown Monitor, image 3
Trading product for Monthly Return Table Indicatore Drawdown Monitor, image 4
Trading product for Monthly Return Table Indicatore Drawdown Monitor, image 5
Trading product for Monthly Return Table Indicatore Drawdown Monitor, image 6
Trading product for Monthly Return Table Indicatore Drawdown Monitor, image 7
Da 22/09/2024
15
Vendite
3.88K
Installazioni gratuite

Descrizione

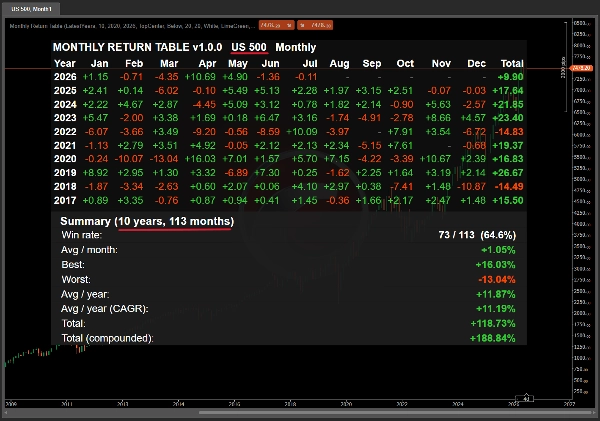
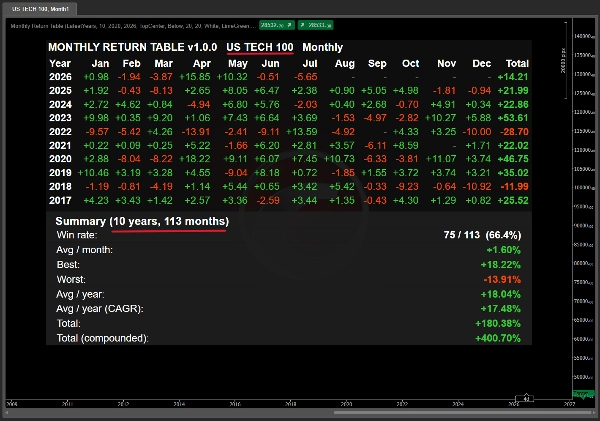
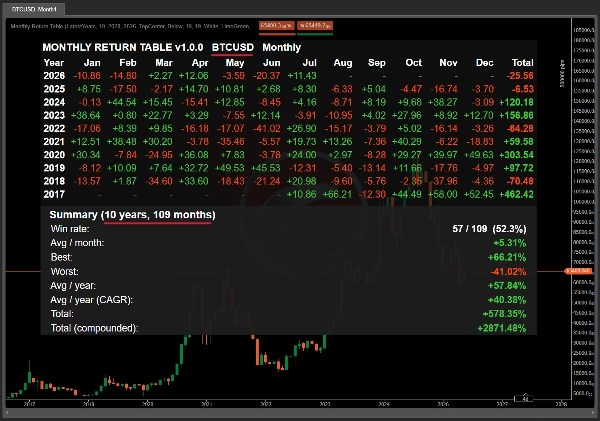
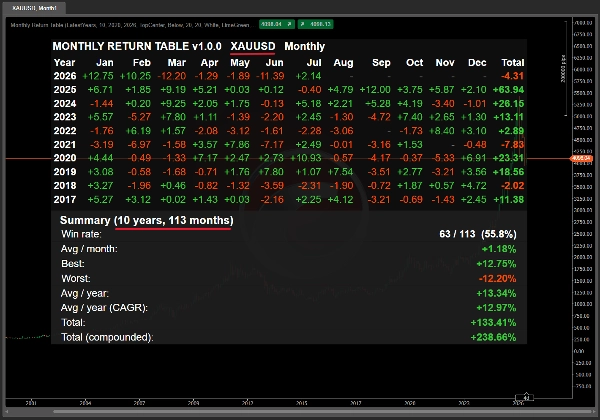
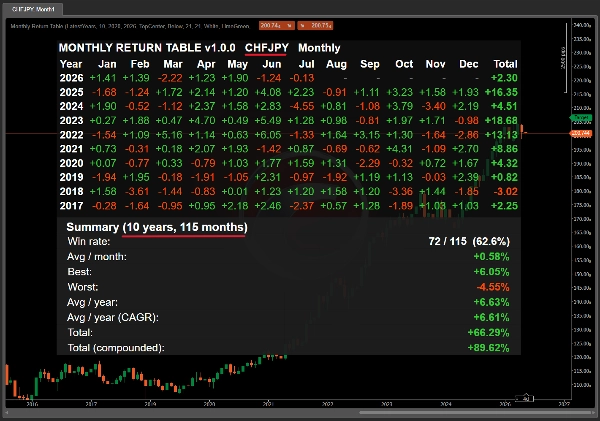
See any asset's historical performance in one glance — no backtest required.


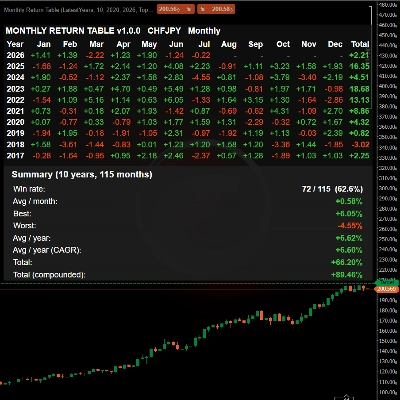
Drop it on any chart. Instantly see monthly returns for the last 10+ years, color-coded by profit and loss, with a full statistical summary. Works on any symbol, any timeframe — Forex, Metals, Indices, Crypto. The fastest way to answer: "Is this asset actually worth trading?"


WHAT IT DOES


Monthly Return Table calculates the monthly percentage return of any asset — open of the first bar of the month to close of the last bar — and displays it as a clean, color-coded matrix directly on your chart.


No backtest. No optimization. No waiting.

Attach it, and the entire performance history appears in under a second.


WHY IT EXISTS


Before you invest capital, deploy a bot, or design a strategy, you should know one thing: how has this asset actually behaved?


Most traders skip this step. They open a chart, see recent price action, and make decisions based on the last few months. Monthly Return Table forces you to look at the full picture — every month, every year, side by side.


You'll immediately see:

• Which months tend to be strong or weak (seasonality)

• Whether the asset trends or ranges over time

• The realistic drawdown you should expect

• The compounded return of simply holding through each month


KEY FEATURES


• Full monthly matrix — 12 months × up to 30 years, all on one screen

• Color-coded cells: green profit, red loss

• Complete statistical summary: Win rate, Avg/month, Best, Worst, Avg/year, CAGR, Total (simple + compounded)

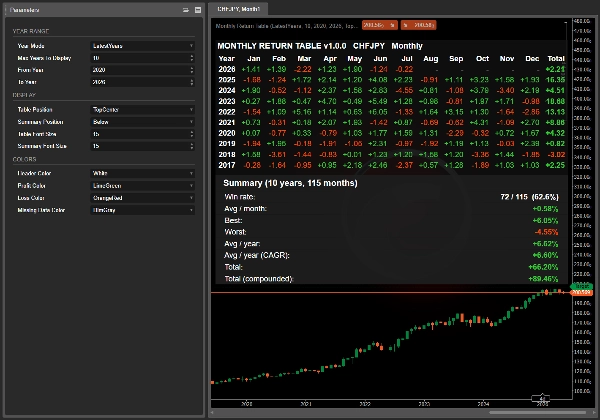
• Year Mode: Latest N years OR specific range (e.g. 2020-2022)

• 9 chart positions, adjustable font sizes, custom colors

• Timezone-aware month detection — works correctly with every broker

• Zero configuration required

• No repainting, no lag, no external data


WHO THIS IS FOR


• Retail traders who want to stop guessing and decide based on real historical data

• Bot users and buyers who want to evaluate a symbol before committing capital

• Portfolio builders comparing candidates for consistent, compoundable returns

• Content creators needing clean, professional performance visualizations


WHAT IT IS NOT


This is not a trading signal. It doesn't tell you when to buy or sell. It doesn't predict the future.


What it does is answer a simple, foundational question every trader should ask before touching an asset: "Show me the numbers."


Stop guessing. Start seeing.


Built by Black Rock — Forex & Gold trading specialists. Full support via cTrader messaging. Updates included.

Riepilogo

Profilo indicatore
Categoria indicatore
Trend
Tipo di output
Filtro
Requisiti per i dati
Solo barre

Discussioni

Recensioni dei clienti

0.0
Recensioni: 0
Recensioni dei clienti
Questo prodotto non ha ancora ricevuto recensioni. L'hai già provato? Fallo sapere agli altri per primo!

Domande frequenti

Drawdown Monitor
I prodotti disponibili tramite cTrader Store, inclusi bot di trading, indicatori e plugin, sono forniti da sviluppatori terzi e resi disponibili esclusivamente a scopo informativo e di accesso tecnico. cTrader Store non è un broker e non fornisce consulenze in materia di investimento, raccomandazioni individualizzate o garanzie di risultati futuri.

Altro da questo autore
cBot
BTCUSD
GBPUSD
+4
Scalping V.1 (Stop Order TP + SL)
cBot
Grid
Forex
+5
Algo Forex Strategy
cBot
NAS100
XAUUSD
+3
Renko SPX500
cBot
BTCUSD
NAS100
+4
Renko Strategy
cBot
Grid
Forex
+2
Algo Forex (Free Trial_USDJPY)
Logo di "The Secret Fund"
Statistiche in tempo reale
$990
/
$1900
cBot
Grid
Prop
+4
The Secret Fund ( Secret from Hedge Fund Strategy)
cBot
AI
Grid
+7
Algo Forex Strategy ( Trial )
cBot
Grid
XAUUSD
+2
🔥 Grid Classic – A Simple Yet Powerful Grid System
cBot
BTCUSD
EURUSD
+8
Renko Strategy Free Trial
cBot
AI
Grid
+9
Stop gambling your capital. Switch to a truly sustainable "System" instead.
cBot
ATR
RSI
+5
Shift from “Price Chasing” to “Price Trapping” using Limit Orders and a Volatility-Based Calculation System
cBot
AI
Grid
+3
HFT SuperFund Pro+

Potrebbe interessarti anche

Indicatore
Smoothed CCI alerts! Audio & arrow signals for +/-100 crosses. Custom sounds & arrow filters. Precision trading!
Indicatore
Forex
BTCUSD
+7
🚀 TMAX RBA Indicator - The Ultimate Multi-Timeframe Momentum System 🚀
Indicatore
Volume
Support & Resistance
Compare up to 27 symbols across eight timeframes with seven analysis engines and an interactive cTrader dashboard.
Indicatore
Forex
Customizable Dynamic Fibonacci Channels and Smart Alerts
Indicatore
ATR
RSI
+5
Delta RSI Candle Pro, the indicator that transforms ordinary candlesticks into powerful momentum visualizers.
Indicatore
Forex
BTCUSD
+5
Trend analysis, automatic analysis, position, swingtrader, scalper
Indicatore
Forex
BTCUSD
+11
Catch High-Probability Reversals with Precision Swing
Indicatore
Prop
Forex
+4
Personal trade tracker for a single symbol. Clear net profit summary — FreshNet, ManageNet, DayNet, WTDNet, MTDNet.
Indicatore
BOS
EMA
+5
VWAP Bands indicator with 3 standard deviation levels, buy/sell zones, and a draggable ON/OFF button to toggle the entir
Indicatore
Prop
Forex
+13
Supertrend - Multi-Timeframe Indicator
Indicatore
XAUUSD
Professional Volume Profile Indicator - Shows volume distribution, POC, Value Areas & Buy/Sell pressure.
Indicatore
MCDX is a powerful and innovative indicator.
Indicatore
Drawdown Monitor
Protect your funded account. Real-time Daily Equity Drawdown monitor with Green / Orange / Red flashing alerts.
Indicatore
Zero Lag MACD delivers ultra-responsive trend and divergence signals with minimal lag, empowering timely Forex entries.
Indicatore
ATR
Volume
+3
Fibonacci trend signals on closed bars, with an ATR stop, up to four targets and a break-even ladder.
Indicatore
Supertrend
Moving Average
Easy Trade: Trend & Breakout Indicator for cTrader
Indicatore
ATR
MSS
+5
Advanced market structure and institutional cycle mapper with visual reference cards and entry alerts
Indicatore
SMC
Prop
+15
Automatic Elliott Wave Detection with Professional Filters

Prezzo

Da 22/09/2024
15
Vendite
3.88K
Installazioni gratuite