
Beschreibung
## 📊 Was ist Squeeze Momentum Pro?
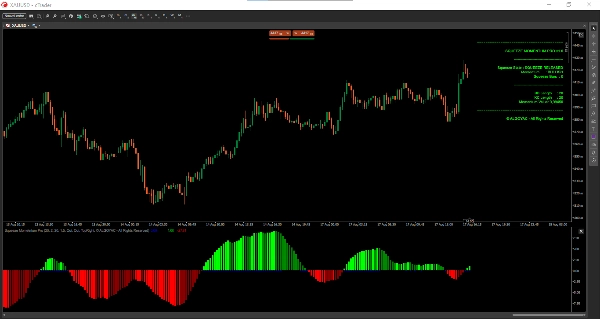
Squeeze Momentum Pro ist ein professioneller Volatilitäts- und Momentum-Indikator, der auf der renommierten Squeeze-Strategie basiert, die von John Carter populär gemacht wurde. Er identifiziert Phasen der Marktkompression (Squeeze) und antizipiert explosive Ausbruchsbewegungen, bevor sie auftreten.
Der Indikator kombiniert zwei leistungsstarke Volatilitätsmessinstrumente:
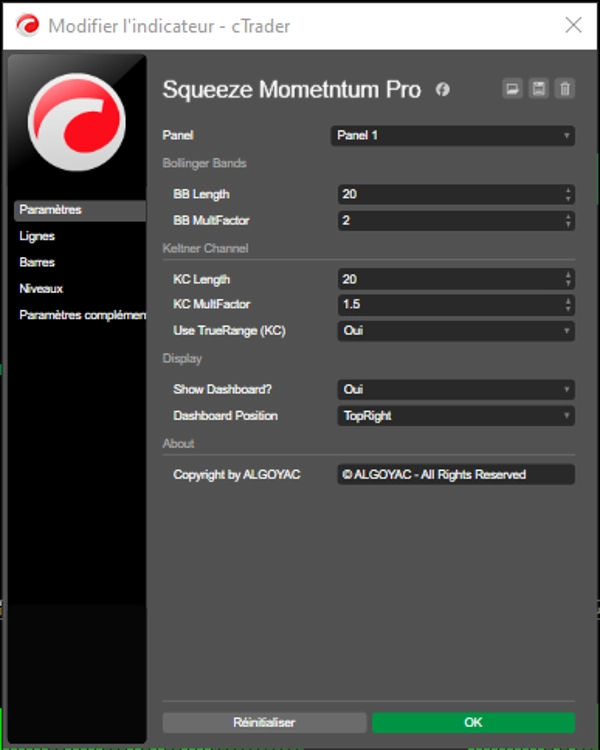
- **Bollinger Bands** (20 Perioden, 2,0 Standardabweichung)
- **Keltner Channels** (20 Perioden, 1,5 ATR-Multiplikator)
Wenn die Bollinger Bands innerhalb der Keltner Channels zusammenziehen, wird ein "Squeeze" erkannt, der signalisiert, dass der Markt Energie für eine potenzielle explosive Bewegung aufbaut.
## 🎯 Hauptmerkmale
### 1. Squeeze-Erkennungssystem
- **Schwarze Punkte** = Squeeze aktiv (Markt komprimiert sich, Bereitmachen für Ausbruch)
- **Blaue Punkte** = Squeeze freigegeben (Ausbruch findet statt, auf Momentum-Richtung achten)
- **Graue Punkte** = Kein Squeeze (normale Marktbedingungen)
### 2. Momentum-Histogramm
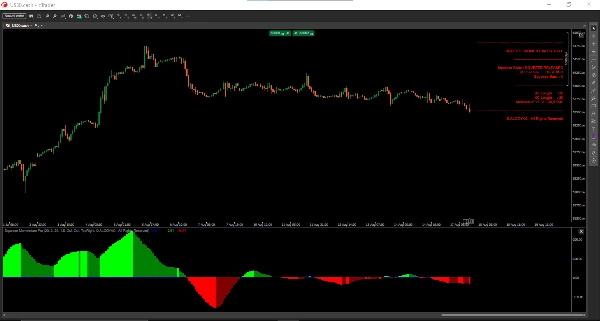
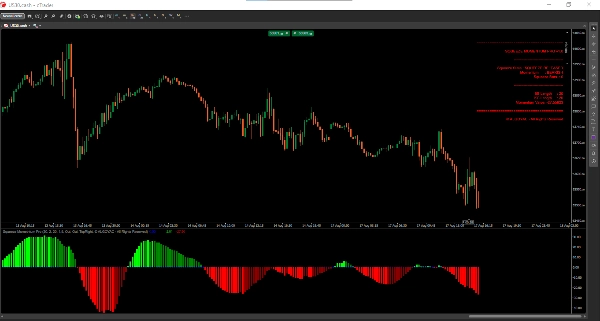
Das Histogramm zeigt das Marktmomentum mit 4 verschiedenen Farben an:
- **Limettengrün** = Starkes bullisches Momentum (steigend)
- **Dunkelgrün** = Schwaches bullisches Momentum (fallend)
- **Rot** = Starkes bärisches Momentum (fallend)
- **Dunkelrot** = Schwaches bärisches Momentum (steigend)
### 3. Echtzeit-Dashboard
Integriertes Dashboard zeigt:
- Aktueller Squeeze-Zustand
- Momentum-Richtung
- Anzahl der Bars im Squeeze
- Aktive Parameter
## 📈 Wie man Signale interpretiert
### Squeeze + Momentum-Ausbruch
Wenn das Histogramm von Rot auf Limettengrün wechselt, während es aus einem Squeeze (schwarze Punkte) herauskommt, stellt dies ein starkes bullisches Signal dar.
### Squeeze-Dauer
Längere Squeeze-Perioden führen oft zu stärkeren Ausbrüchen. Das Dashboard zeigt die Anzahl der Bars im Squeeze an, um die potenzielle Volatilität einzuschätzen.
### Momentum-Farbwechsel
- **Rot → Dunkelrot** : Verkaufsdruck nimmt ab, potenzielle Umkehr
- **Limette → Grün** : Kaufdruck nimmt ab, potenzielle Umkehr
- **Dunkelrot → Limette** : Starke bullische Umkehr
- **Grün → Rot** : Starke bärische Umkehr
## ⚙️ Einstellungen & Parameter
### Bollinger Bands Gruppe
- **BB Länge** (Standard: 20) : Periode für die Berechnung der Bollinger Bands
- **BB MultFaktor** (Standard: 2,0) : Multiplikator der Standardabweichung
### Keltner Channel Gruppe
- **KC Länge** (Standard: 20) : Periode für die Berechnung des Keltner Channels
- **KC MultFaktor** (Standard: 1,5) : ATR-Multiplikator
- **TrueRange verwenden** (Standard: true) : Umschalten zwischen True Range und High-Low Range
### Anzeige Gruppe
- **Dashboard anzeigen** (Standard: true) : Echtzeit-Informationspanel anzeigen
- **Dashboard Position** : Auswahl aus 4 Positionen
## 💼 Typische Anwendungsfälle
### Scalping
- Verwendung auf M1-M5 Zeitrahmen
- Einstieg bei Squeeze-Freigabe mit Momentum-Bestätigung
- Ausstieg bei Farbwechsel des Momentums
### Day Trading
- Verwendung auf M15-H1 Zeitrahmen
- Kombination mit Unterstützungs-/Widerstandsniveaus
- Einstieg beim ersten Rücksetzer nach Squeeze-Freigabe
### Swing Trading
- Verwendung auf H4-D1 Zeitrahmen
- Suche nach Multi-Bar-Squeezes
- Einstieg bei Momentum-Farbwechsel von Rot zu Limette (oder umgekehrt)
## 👥 Für wen ist dieser Indikator geeignet?
### Geeignet für:
- **Breakout-Trader** : Erkennen von Momentum vor Ausbrüchen
- **Volatilitäts-Trader** : Einschätzung von Marktkompressionsphasen
- **Momentum-Trader** : Verfolgen von Trendstärke und Umkehrungen
- **Anfänger bis Fortgeschrittene** : Intuitive Oberfläche mit professionellen Funktionen
### Erfahrungsstufe:
- **Anfänger** : Starten mit Standardeinstellungen, Dashboard zur Orientierung nutzen
- **Fortgeschrittene** : Parameter für spezifische Märkte anpassen
- **Experten** : Kombination mit Preisaktion und mehreren Zeitrahmen
## ⚠️ Wichtige Hinweise & Einschränkungen
1. **Falsche Ausbrüche** : Nicht alle Squeezes führen zu starken Ausbrüchen. Immer zusätzliche Bestätigung verwenden.
2. **Marktbedingungen** : Funktioniert am besten in Trendmärkten. Kann in Seitwärtsmärkten falsche Signale geben.
3. **Parametersensitivität** : Standardeinstellungen funktionieren für die meisten Märkte gut, müssen aber für bestimmte Instrumente angepasst werden.
4. **Kein eigenständiges System** : Am besten in Kombination mit anderen technischen Analysewerkzeugen zur Bestätigung verwenden.
5. **Vergangene Leistung** : Historische Signale garantieren keine zukünftigen Ergebnisse.
## 🔧 Empfohlene Einstellungen nach Markt
| Markt | BB Länge | KC Länge | Zeitrahmen |
|--------|-----------|-----------|-----------|
| Forex | 20 | 20 | H1-H4 |
| Aktien | 20 | 20 | D1 |
| Krypto | 30 | 30 | H1-H4 |
| Indizes| 25 | 25 | M15-H1 |
## 🚀 Erste Schritte
1. Fügen Sie den Indikator Ihrem Chart hinzu
2. Behalten Sie zunächst die Standardeinstellungen bei
3. Achten Sie auf schwarze Punkte (Squeeze bildet sich)
4. Warten Sie auf die Squeeze-Freigabe (blaue Punkte)
5. Bestätigen Sie mit der Momentum-Farbe (Limette für Kauf, Rot für Verkauf)
6. Verwenden Sie das Dashboard für eine schnelle Übersicht
Zusammenfassung
Key features include a squeeze detection system with color-coded dots (black for active squeeze, blue for squeeze release, gray for no squeeze), and a momentum histogram displaying four colors to represent bullish and bearish momentum strength and direction. A real-time dashboard provides current squeeze status, momentum direction, squeeze duration, and active parameters.
The indicator supports multiple trading styles and timeframes: scalping (M1-M5), day trading (M15-H1), and swing trading (H4-D1). It is suitable for breakout, volatility, and momentum traders across markets such as Forex, stocks, crypto, and indices, with recommended parameter settings for each.
Users interpret signals by monitoring squeeze states and momentum color transitions to identify potential entries and exits. Adjustable settings allow customization of Bollinger Bands and Keltner Channel parameters, as well as dashboard display options. The indicator is designed for use alongside other technical analysis tools to confirm signals.
Kundenbewertungen
5 | 50 % | |
4 | 50 % | |
3 | 0 % | |
2 | 0 % | |
1 | 0 % |















![„[Hamster-Coder] Moving Average MTF“-Logo](https://cdn.ctrader.com/image/webp/b11b98b1-194d-4b8e-b00e-d611826ad159_31226)