present
가입하고 첫 구매 시 $50 할인을 받으세요
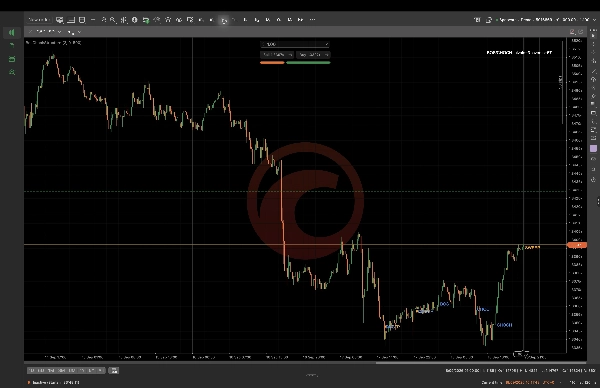
Trading product for BOS CHOCH Structure 지표 Key Levels MSS, image 1
BOS CHOCH Structure
지표
버전 1.0, Sep 2026
Windows, Mac
4.5
리뷰: 4
Trading product for BOS CHOCH Structure 지표 Key Levels MSS, image 2
Trading product for BOS CHOCH Structure 지표 Key Levels MSS, image 3
Trading product for BOS CHOCH Structure 지표 Key Levels MSS, image 4
Trading product for BOS CHOCH Structure 지표 Key Levels MSS, image 5
Trading product for BOS CHOCH Structure 지표 Key Levels MSS, image 6
Trading product for BOS CHOCH Structure 지표 Key Levels MSS, image 7
Trading product for BOS CHOCH Structure 지표 Key Levels MSS, image 8
Trading product for BOS CHOCH Structure 지표 Key Levels MSS, image 9
가입일 16/09/2026

설명

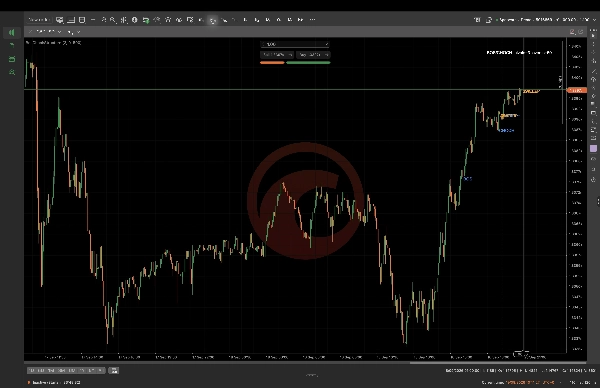
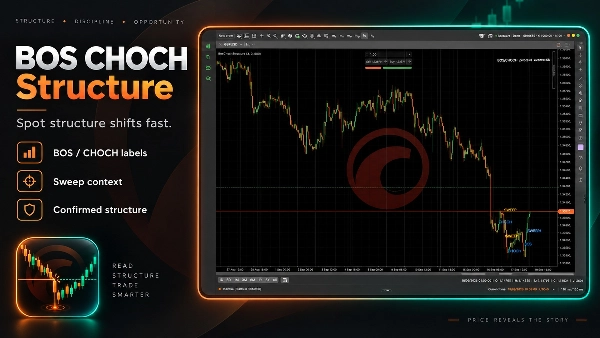
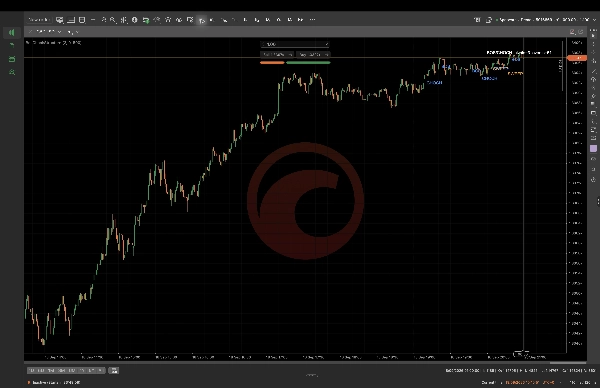
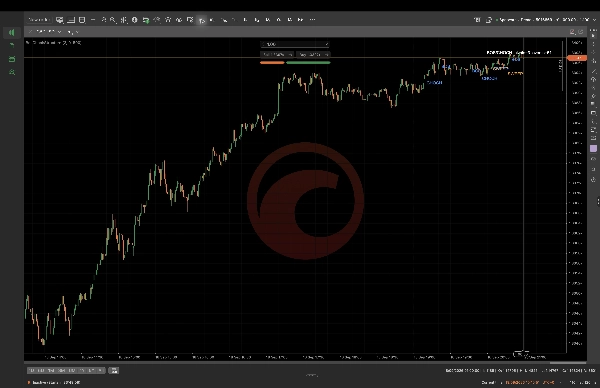
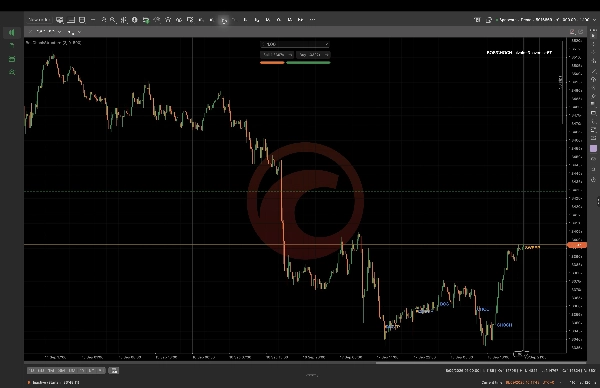
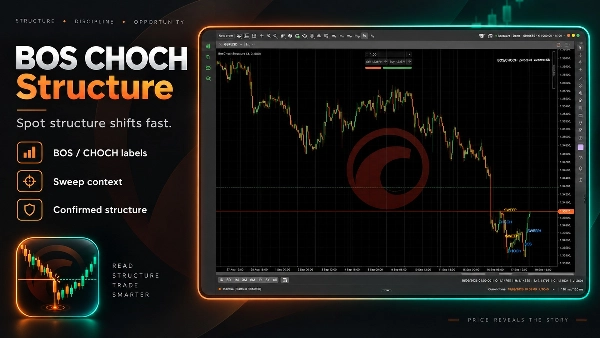
BOS CHOCH 구조는 가격 차트에서 확인된 시장 구조를 읽기 위한 cTrader 지표입니다. OHLC 바와 확인된 피벗을 분석한 후, 차트 위에 구조 붕괴(BOS), 성격 변화(CHOCH), 그리고 심지 쓸기 이벤트를 시각적 주석으로 표시합니다. 피벗 강도, 붕괴 버퍼, 그리고 히스토리 깊이를 사용하여 선호하는 도구와 기간에 맞게 뷰를 조정할 수 있습니다. 이는 외환 및 지수 시장에서 일중 및 상위 시간대 검토를 포함한 임의 차트 분석을 위해 설계되었습니다. 라벨은 예측이나 자동 거래 실행이 아닌 확인 보조 도구입니다. 신호는 완료된 바 데이터와 선택된 매개변수에 따라 달라지며, 이 지표는 주문을 실행하거나 결과를 보장하지 않습니다.

요약

AI 요약
BOS CHOCH Structure is a cTrader indicator designed to identify and display confirmed market structure events directly on price charts. It analyzes OHLC bars and confirmed pivot points to visually mark Break of Structure (BOS), Change of Character (CHOCH), and wick Sweep events as on-chart annotations. Users can adjust parameters such as pivot strength, break buffer, and history depth to customize the indicator’s sensitivity for various instruments and timeframes. The tool supports discretionary analysis primarily for forex and index markets, suitable for both intraday and higher timeframe reviews. It provides confirmation aids based on completed-bar data but does not generate predictive signals or execute trades automatically. This indicator focuses on visualizing key market structure shifts and liquidity grabs to assist traders in their chart analysis.
지표 프로필
지표 카테고리
시장 구조 (SMC)
출력 유형
시각화
데이터 요구 사항
막대만
지원되는 신호
돌파
반전

상담

고객 리뷰

4.5
리뷰: 4
5
50 %
4
50 %
3
0 %
2
0 %
1
0 %
고객 리뷰
October 26, 2026
Confirmed pivots, completed candles and an adjustable break buffer give the BOS, CHoCH and wick sweep labels a clear, inspectable basis rather than an undefined notion of market structure.
October 20, 2026
Wick sweeps beside confirmed structure give the chart some welcome nuance. Pivot strength and the break buffer define what is significant. The overlay has clear rules to inspect rather than another unexplained claim to know the next break.
October 14, 2026
The break buffer and pivot strength let the meaning of structure be adjusted openly. BOS and CHoCH follow completed candles and confirmed pivots. That makes the markings fairly transparent instead of hiding their sensitivity behind a label.
October 12, 2026
Confirmed pivots and completed bars give the BOS and CHoCH labels a reasonably clear foundation. Pivot strength and the break buffer expose sensitivity, with wick sweeps recorded as structural events rather than forecasts of the next move.

자주 묻는 질문(FAQ)

Key Levels
MSS
BOS
CHOCH
Market Structure
Liquidity Grab
트레이딩 봇, 지표, 플러그인 등 cTrader Store에서 제공되는 상품은 제3자 개발자에 의해 제공되며, 이는 단순히 정보 및 기술적 접근을 목적으로 제공된 것입니다. cTrader Store는 중개인이 아니며, 투자 조언, 개인별 추천 또는 향후 성과에 대한 어떠한 보장도 제공하지 않습니다.

이 작성자의 상품 더 보기
지표
BOS
Add standard-timeframe context candles to a native Renko chart.
지표
EMA
Volume
Map range high, mid, low, price location and a deterministic pressure proxy on your cTrader chart.
지표
Channel
Key Levels
+1
Monitor a selected chart trendline and confirm breaks on candle close.
데스크톱 플러그인
Trade Journal
Trade Statistics
Review daily PnL, trade counts, losing streaks and rapid re-entry from your cTrader history.
데스크톱 플러그인
Chart UI Tools
Keep lines, zones and channels synced across selected same-symbol charts from one desktop plugin.
cBot
Drawdown Guard
Daily Loss Limit
Monitor account-wide loss and stop-loss risk budgets, with optional order cancellation and post-fill closure.
데스크톱 플러그인
Position Sizer
Risk Calculator
Size manual trades from your risk settings and review Market, Limit or Stop orders before execution.
지표
Volume
Key Levels
View tick activity across a selected chart range with Point of Control, Value Area High and Value Area Low.

좋아하실 만한 다른 항목

지표
VWAP
Volume
+5
Multi VWAP. Three timeframes. One clean chart. Your Essential Trading Tool.
지표
Prop
Forex
+4
Personal trade tracker for a single symbol. Clear net profit summary — FreshNet, ManageNet, DayNet, WTDNet, MTDNet.
지표
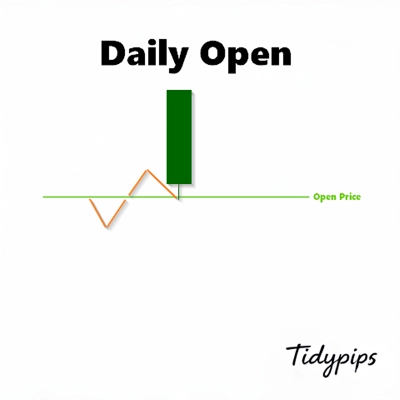
This indicator is a valuable tool for traders looking to identify significant opening price level of any asset.
지표
ATR
Key Levels
+1
Explore 88 harmonic price-pattern variants with interactive chart controls and geometric reference levels.
지표
RSI
BTCUSD
+5
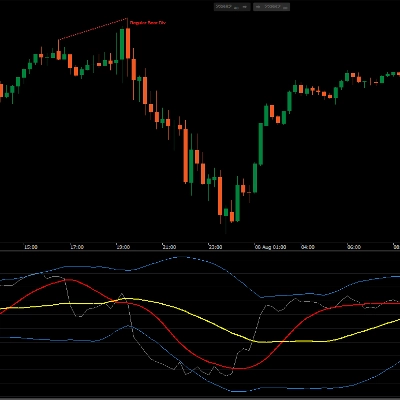
Traders Dynamic Index (TDI) — Divergence Edition
지표
Moving Average
Support & Resistance
Adaptive, low-lag moving average designed to smooth noise while responding quickly to changing market conditions.
지표
Key Levels
Liquidity Grab
+1
Visualize Asia, London and New York sessions with range boxes, opening levels, prior-day highs/lows and sweep markers.
지표
Forex
Alerts you when price touches Fibonacci levels. Stay organized and trade efficiently!
지표
AI
Forex
+3
Smart Money FVG & Imbalance Detector – Precision Institutional Tool
지표
SMC
Prop
+14
an all-in-one Smart Money Concepts (SMC) toolkit featuring Premium/Discount zones.
지표
ATR
RSI
+14
A metric that can set 1 to 3 groups of Bollinger Bands
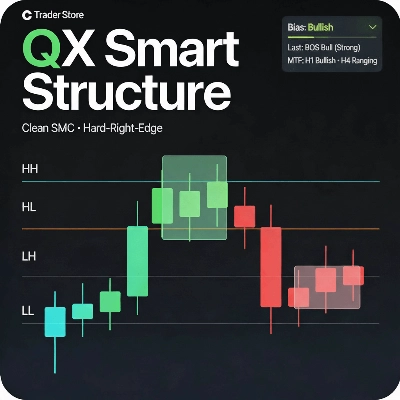
"QX SmartStructure" 로고
최고 평점
4.7
(4)
$26
/
$50
지표
AI
ATR
+26
SMC without the mess: Clean structure + auto-managing FVGs + MTF panel. Hard-right-edge, step size-based for any symbol.
지표
RSI
Signal
+2
Identifies trends with moving averages & volatility. Base levels = bullish 🐂 or bearish 🐻 signals. Reversals detected!
지표
Drawdown Monitor
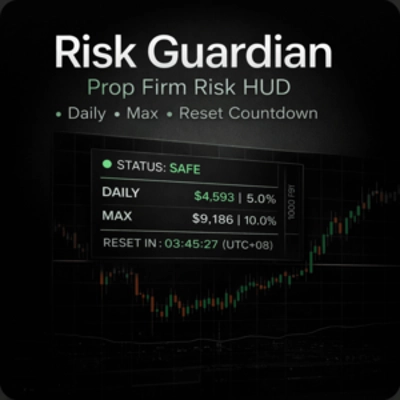
Protect your funded account. Real-time Daily Equity Drawdown monitor with Green / Orange / Red flashing alerts.
지표
Prop
Forex
+12
A clean, real-time risk HUD designed to prevent prop firm account failure and protect your challenge account.
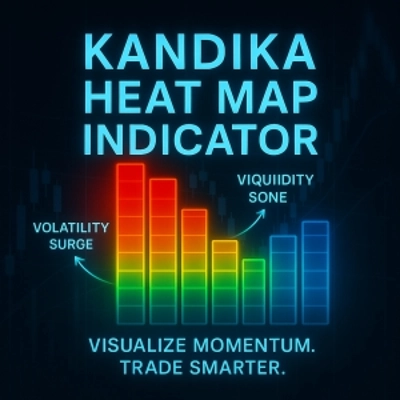
"KANDIKA HEAT MAP" 로고
최고 평점
4.6
(5)
$19
지표
Color-Based Market Pressure & Volatility Visualizer The Kandika Heatmap Indicator
지표
Key Levels
Liquidity Grab
+2
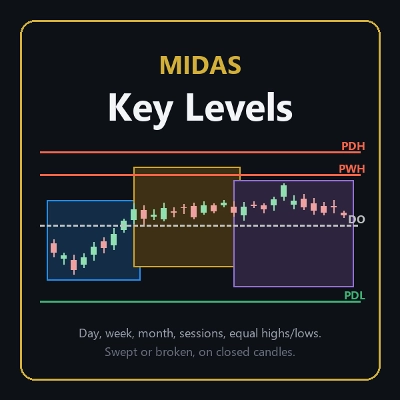
The levels you mark each morning, drawn and followed: PDH/PDL, weekly, monthly, sessions, equal highs/lows.
지표
RSI
SMC
+4
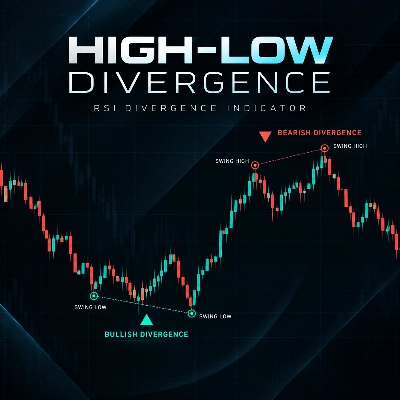
High Low Divergence is a clean, overlay indicator that automatically identifies swing highs and swing lows

가격

가입일 16/09/2026