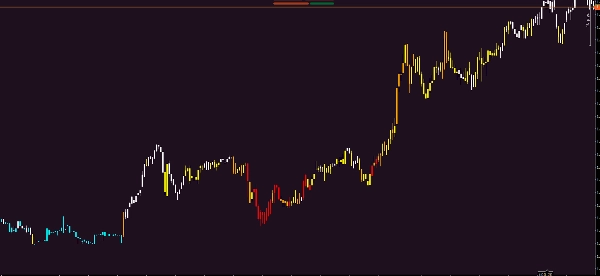
HeatMap Candle
"HeatMap Candle" 로고
03/09/2025
51
Desktop
Since 10/02/2025
Free installs
472
"HeatMap Candle" 업로드된 이미지

HeatMap Candle

이 작성자의 상품 더 보기
지표
VWAP
VWAP Tabajara
VWAP Tabajara
sma color
sma color
Larry Williams 9.1
Larry Williams 9.1
HTFOverlayPlus
HTFOverlayPlus
price quote
price quote
Tabajara corrigido[fix]
corrigido todos os bugs e cores invertidas tabajara antigo deleetado
좋아하실 만한 다른 항목
지표
NAS100
NZDUSD
XAUUSD
+11
RT VWAP
Unlock VWAP in cTrader! Choose anchor periods, price sources, and display deviation bands with real-time tick updates.
지표
Grid
NAS100
NZDUSD
+15
RangeBoxFibonacci
With this Fibonacci retracement indicator, traders have full control over the retracement levels displayed on the chart.
E7 cTrader User ID
cTrader ID
지표
NAS100
NZDUSD
Martingale
+22
Zigzag Trend
The ZigZag Trend is a market structure tool that filters out small price fluctuations and highlights major swing.
지표
Bollinger
BB Width
Indicatore di volatilità che filtra quando le bande di Bollinger sono in espansione
지표
RSI
Breakout
Supertrend
Leverage Liquidation Map
📊 Liquidation Map: Potential areas where highly leveraged investors might face liquidations.
BWMFI_Visual
BW_MFI Vizual colors bars
MMXM Structure by Ludwig
MMXM Structure by LudwigICT – Professional Market Structure Mapping Tool
지표
Indices
RSI
Stocks
+5
REDGREENZONEREVERSAL
The Red & Green Zone Reversal Indicator detects overbought and oversold market conditions using Bollinger Bands and RSI.
AlgoCorner Market Sessions
Show each Market Session with full details, including grid mode for higher timeframes, statistics, and other metrics.
DEnvelopSystem
DEnvelop is a high-performance trading indicator engineered for scalpers and intraday strategists who demand precision.
VolumeProfile_8
Scalpers Volume Profile
지표
NAS100
EURUSD
GBPUSD
Ema
An exponential moving average based on regular trading hours.
Smart Floating Risk Pro
📊 Smart Floating Risk Pro – Advanced Risk Management for cTrader
지표
Indices
XAUUSD
Breakout
+3
AnchoredVWAP
A precision overlay tool that combines session-aware VWAP logic and standard deviations.
지표
Breakout
AutoLines™ Support & Resistance
FlexSR auto‑detects pivot highs/lows to plot dynamic support & resistance lines Features customizable styling and option
지표
Breakout
ATR
Signal
[Stellar Strategies] Market Structure Breakout
Flags breakouts of recent highs/lows on cTrader charts. Shows arrows/lines. Optional trend filter & sound alerts 📉📈