ADX Indicator_noSourceCode
Indikator
Versi 1.0, Sep 2025
Windows, Mac
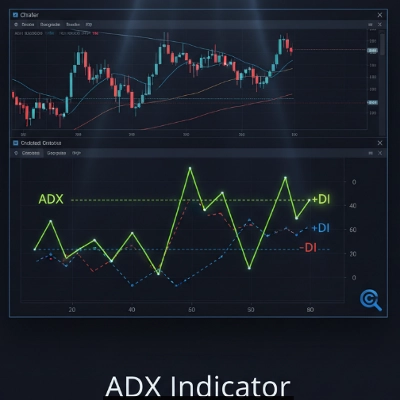
Kenal Pasti Kekuatan Trend dengan Ketepatan Mutlak pada cTrader
Penat berdagang melawan trend? Kami mempersembahkan Penunjuk ADX Pro, alat utama untuk menafsirkan kekuatan dan arah pasaran, dibina khas untuk platform cTrader anda.
Penunjuk ini bukan sekadar satu garis pada carta anda. Ia adalah kompas pasaran anda, dengan pengiraan yang dioptimumkan dan reka bentuk visual yang bersih supaya anda mempunyai maklumat yang anda perlukan pada masa yang tepat.
Dengan Penunjuk ADX kami, anda akan:
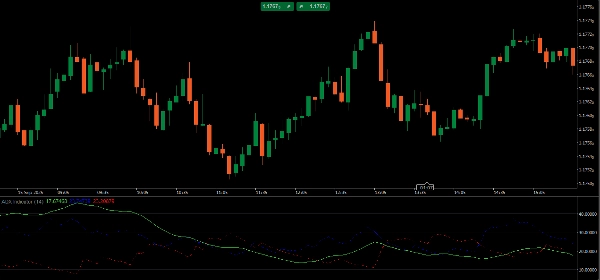
- Fahami Trend: Segera ketahui jika pasaran mempunyai kekuatan untuk pergerakan ke atas atau ke bawah.
- Elakkan Perangkap: Berhenti berdagang dalam pasaran mendatar dan membuang masa serta wang. ADX menunjukkan bila trend lemah.
- Berdagang dengan Keyakinan: Dengan garis ADX, +DI, dan -DI, anda mendapat visualisasi lengkap untuk membuat keputusan yang lebih selamat dan bijak.
Sedia digunakan, sempurna, dan dengan reka bentuk yang memfokuskan prestasi anda. Tingkatkan analisis pasaran anda dan ambil kawalan ke atas dagangan anda.
Profil indikator
0.0
Ulasan: 0
Ulasan pelanggan
Belum ada ulasan untuk produk ini. Anda sudah mencuba produk tersebut? Jadilah yang pertama untuk berkongsi pendapat anda!
Prop
Forex
Indices
Commodities
Crypto
Stocks
Produk yang tersedia melalui cTrader Store, termasuk bot dagangan, indikator dan plugin, disediakan oleh pembangun pihak ketiga dan diberikan akses untuk tujuan maklumat dan teknikal sahaja. cTrader Store bukan broker dan tidak memberikan nasihat pelaburan, syor peribadi atau sebarang jaminan prestasi masa hadapan.


![Logo "[CB] Pivot Points Pro"](https://cdn.ctrader.com/image/webp/43463c82-67b0-4f10-a4ba-901bba091d81_32594)


Sejak 05/02/2025
30
Jualan