AbsorptionRatio_AutoRiskPanel
Indikator
Versi 1.0, Dec 2025
Windows, Mac
5.0
Ulasan: 1
Deskripsi
AbsorptionRatio_AutoRiskPanel mengubah simbol cTrader apa pun menjadi dasbor rezim risiko langsung 🛰️.
Alih-alih mengandalkan beberapa ETF seperti Absorption Ratio multi-aset asli, indikator ini membangun proxy AR simbol tunggal langsung dari aksi harga instrumen yang Anda perdagangkan:
- 📉 Ini menghitung log return dari simbol saat ini.
- 🔗 Ini mengukur autokorelasi return di beberapa lag (1…7 bar, tergantung periode korelasi).
- 📊 Ini mengagregasi rata-rata autokorelasi absolut dan memetakannya ke dalam Absorption Ratio ternormalisasi antara 0,5 dan 1,0 — nilai yang lebih tinggi berarti konsentrasi lebih besar dan perilaku lebih ketat.
- 🧬 Ini menghaluskan sinyal mentah dengan EMA, menghasilkan kurva AR yang stabil.
- 🧪 Selama statistical lookback bergulir, ia menghitung:
-
- rata-rata dan deviasi standar dari AR
- Z-Score saat ini (berapa banyak σ di atas/bawah rata-rata)
- peringkat persentil AR hari ini dibandingkan dengan sejarah
- 🤖 Dengan Auto Thresholds diaktifkan, indikator secara terus-menerus mengkalibrasi sendiri level risiko:
-
- Risiko Rendah ≈
rata-rata − 0,5σ - Risiko Tinggi ≈
rata-rata + 0,5σ - Risiko Ekstrem ≈
rata-rata + 1,5σ
Nilai dibatasi pada[0…1]dan diperbarui per bar, sehingga rezim beradaptasi dengan setiap simbol dan kerangka waktu.
- Risiko Rendah ≈
- 🧱 Dari ambang batas ini, AbsorptionRatio_AutoRiskPanel mendefinisikan empat rezim dinamis:
-
- RENDAH → lingkungan tersebar, santai / risk-on
- NORMAL → kondisi seimbang / netral
- TINGGI → pengelompokan meningkat, kecenderungan risk-off
- EKSTREM → lingkungan stres, potensi lonjakan risiko sistemik 🛑
- 🕯️ Pada grafik utama, lilin dapat diwarnai berdasarkan risiko:
Ini memberi Anda filter visual langsung: misalnya, hanya berdagang entri tren ketika lilin tidak berwarna merah/oranye, atau mengurangi ukuran selama rezim stres. -
- 🔴 Merah → AR secara statistik stres (Z-Score ≥ ambang)
- 🟢 Lime → AR secara statistik tenang (Z-Score ≤ −ambang)
- 🟧 / 🟡 Oranye/Kuning → di atas Tinggi / dekat Ekstrem
- ⚪ Abu-abu → zona netral
- 💚 Hijau → AR rendah, perilaku lebih tersebar / risk-on
- 🎯 Sinyal mean-reversion opsional di panel AR:
-
- 🟢 Panah beli saat AR secara statistik tenang dan mulai naik
- 🔴 Panah jual saat AR secara statistik stres dan mulai menurun
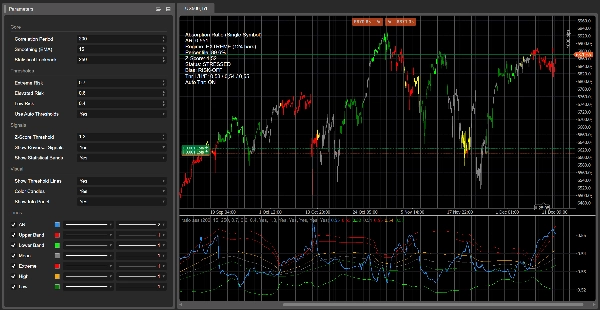
- 📋 Panel info ringkas di sudut kiri atas menampilkan:
-
- nilai AR saat ini
- Rezim aktif + durasi (bar yang dihabiskan dalam rezim ini)
- Persentil, Z-Score dan Status kualitatif (STRESSED / CALM / NORMAL)
- Bias risiko (RISK-ON / RISK-OFF / NETRAL)
- ambang Rendah / Tinggi / Ekstrem efektif yang digunakan dan apakah Auto Thresholds aktif atau tidak
Gunakan AbsorptionRatio_AutoRiskPanel untuk:
- menghindari perdagangan selama rezim risiko-off yang secara statistik stres
- mengidentifikasi lingkungan tenang di mana breakout atau mengikuti tren mungkin lebih efektif
- mengontekstualisasikan strategi apa pun dalam kerangka kerja rezim risiko dinamis daripada menggunakan filter volatilitas tetap.
⚙️ Parameter (dokumen penyimpanan)
Inti ⚙️
- Periode Korelasi – Panjang jendela autokorelasi. Mengontrol seberapa banyak sejarah yang digunakan untuk memperkirakan Absorption Ratio. Nilai lebih besar = rezim yang lebih halus dan “makro”; nilai lebih kecil = lebih cepat tapi lebih berisik.
- Penghalusan (EMA) – Periode EMA yang diterapkan pada sinyal AR mentah. Nilai lebih tinggi menghaluskan perubahan rezim, nilai lebih rendah membuat indikator lebih reaktif.
- Statistical Lookback – Periode lookback untuk rata-rata AR, deviasi standar, Z-Score, dan persentil. Mengatur seberapa cepat baseline statistik beradaptasi.
Ambang Batas 🚦
- Risiko Ekstrem / Risiko Tinggi / Risiko Rendah – Ambang batas manual untuk rezim AR (RENDAH / NORMAL / TINGGI / EKSTREM) yang digunakan saat Auto Thresholds MATI. Saat Auto AKTIF, mereka diabaikan untuk logika dan hanya terlihat sebagai default.
- Gunakan Auto Thresholds – Saat AKTIF, ambang batas diambil dari statistik AR bergulir:
-
- Risiko Rendah = rata-rata − 0,5σ
- Risiko Tinggi = rata-rata + 0,5σ
- Risiko Ekstrem = rata-rata + 1,5σ
Sinyal 🎯
- Ambang Z-Score – Z-Score absolut minimum untuk mengklasifikasikan AR sebagai ekstrem secara statistik. Menggerakkan label STRESSED/CALM, override lilin, dan panah mean-reversion.
- Tampilkan Sinyal Pembalikan – Mengaktifkan/nonaktifkan panah BELI/JUAL di sub-jendela AR.
- Tampilkan Pita Statistik – Mengalihkan pita ±2σ dan garis rata-rata di sekitar AR.
Visual 🎨
- Tampilkan Garis Ambang – Menampilkan level Rendah / Tinggi / Ekstrem efektif yang digunakan oleh mesin rezim (manual atau otomatis).
- Warnai Lilin – Mewarnai lilin harga sesuai dengan Z-Score dan level rezim untuk visualisasi risiko instan.
- Tampilkan Panel Info – Menampilkan panel teks di sudut kiri atas dengan AR, rezim, statistik, dan bias.
Ringkasan
Profil indikator
Ulasan pelanggan
5.0
Ulasan: 1
5 | 100 % | |
4 | 0 % | |
3 | 0 % | |
2 | 0 % | |
1 | 0 % |
Ulasan pelanggan
December 20, 2025
the cleanest use is it makes weak ideas easier to leave alone, and It should stay in the support stack.
Diskusi
Pertanyaan umum
Signal
Indices
Commodities
GBPUSD
RSI
Bollinger
Fibonacci
Scalping
AI
XAUUSD
NAS100
MACD
BTCUSD
Forex
Breakout
EURUSD
NZDUSD
Martingale
Prop
ZigZag
Supertrend
Fair Value Gap
SMC
Crypto
Grid
Stocks
ATR
USDJPY
VWAP
Produk-produk yang tersedia melalui cTrader Store, termasuk bot trading, indikator, dan plugin, disediakan oleh pengembang pihak ketiga serta hanya ditujukan untuk akses teknis dan informasi. cTrader Store bukan broker dan tidak menyediakan saran investasi, rekomendasi pribadi, atau jaminan apa pun tentang kinerja di masa mendatang.


Harga
42.11M
Volume trading
6.13M
Pip dimenangkan
224
Penjualan
8.42K
Instal gratis