Penerangan
Penerangan ringkas
Trend & Volume Regime Map adalah penapis rejim untuk cTrader yang mengukur arah dan ketekalan kedua-dua harga dan volum. Ia memberikan anda skor trend yang dinormalisasi dan skor trend volum dalam julat –10 hingga +10, mewarnakan lilin anda dengan gradasi lancar dari merah menurun ke hijau menaik, dan menunjukkan sama ada persekitaran semasa adalah risiko-aktif, risiko-mati, atau hanya bising.
🧠 Apa yang ia lakukan
Penunjuk ini meniru logik “Regime Filter” BigBeluga dari TradingView, disesuaikan untuk cTrader dan dibungkus dalam peta rejim trend & volum yang jelas.
Harga & volum yang dilicinkan
- Mengira HLC3 (purata Tinggi, Rendah, Tutup) dan menggunakan Hull Moving Average (HMA) untuk melicinkan harga.
- Menggunakan satu lagi Hull Moving Average untuk volum tick.
Skor trend (harga)
- Untuk N bar terakhir (
Length), ia membandingkan HMA harga semasa dengan setiap nilai HMA masa lalu:
- Jika HMA semasa > HMA masa lalu → trend +1
- Jika HMA semasa ≤ HMA masa lalu → trend –1
- Skor terkumpul diskala ke –10 … +10 → ini adalah Nilai Trend.
Skor trend volum
- Menggunakan logik yang sama, tetapi digunakan pada HMA volum.
- Keputusannya adalah satu lagi skor dinormalisasi dalam –10 … +10 → Nilai Volum.
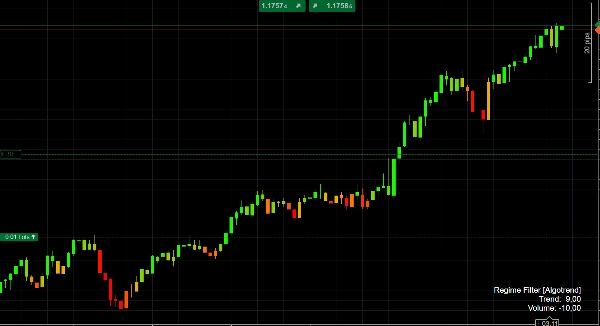
Logik warna
- Apabila Skor Trend adalah negatif, lilin diwarnakan dengan gradasi merah → oren bergantung pada kekuatan rejim menurun.
- Apabila Skor Trend adalah positif, lilin diwarnakan oren → limau, dengan hijau lebih kuat untuk rejim menaik yang lebih kuat.
Ini memberikan anda petunjuk visual segera sama ada tindakan harga adalah menurun, neutral, atau menaik, dan betapa ketekalannya rejim itu pada masa ini.
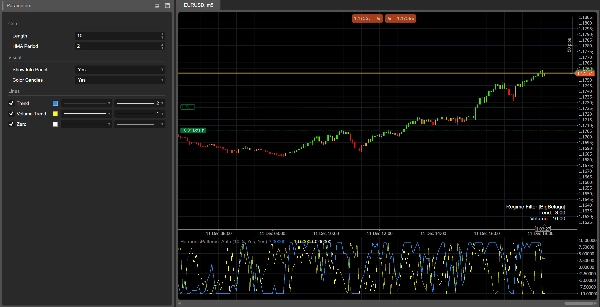
Panel rejim
Dalam sub-tetingkap, penunjuk memplot:
- Garis Trend (biru)
- Garis trend Volum (kelabu)
- Garis sifar (garis dasar)
Pada bar terakhir ia mencetak satu panel info kecil dengan Trend dan Volum semasa.
🎯 Cara anda boleh menggunakannya
Pengesahan trend
- Berniaga hanya dalam arah rejim yang kuat, contohnya:
- Trend > +4 → kecenderungan hanya beli
- Trend < –4 → kecenderungan hanya jual
Penapis rejim
- Matikan atau kurangkan strategi anda apabila rejim lemah (Trend hampir 0) atau apabila trend Volum sangat negatif, yang sering menandakan pergerakan yang tidak menentu atau pudar.
Konteks untuk isyarat
Gabungkan isyarat kemasukan sedia ada anda (tindakan harga, corak harmonik, osilator, dll.) dengan Trend & Volume Regime Map sebagai penapis makro:
- Hanya ambil breakout apabila Trend positif dan trend Volum juga positif.
- Elakkan setup pembalikan purata apabila Trend sangat kuat (> +8 atau < –8), kerana pasaran berada dalam rejim arah yang kuat.
⚙️ Parameter input
Teras
Length
Bilangan bar yang digunakan untuk membina skor trend dan volum.
- Nilai lebih tinggi → rejim yang lebih licin, lebih “makro”; lebih lambat berubah tetapi lebih stabil.
- Nilai lebih rendah → tindak balas lebih cepat, tetapi lebih bising dan lebih kerap berubah.
Tempoh HMA
Tempoh Hull Moving Average yang digunakan untuk melicinkan harga dan volum.
- Sesuaikan mengikut jangka masa dan gaya perdagangan anda: lebih pendek untuk jangka masa rendah, lebih panjang untuk jangka masa tinggi.
Visual
Tunjukkan Panel Info
Menunjukkan/menyembunyikan panel teks kecil pada bar terakhir dengan skor Trend dan Volum semasa.Warna Lilin
Mengaktifkan pewarnaan lilin berdasarkan nilai Trend (gradasi merah / oren / hijau). Matikan jika anda lebih suka mengekalkan warna carta lalai anda.
✅ Lembaran cheat tafsiran
- Trend ≥ +7 → rejim menaik yang kuat, lilin hijau terang.
- Trend antara +3 dan +7 → kecenderungan menaik; penurunan adalah zon potensi beli.
- Trend antara –3 dan +3 → mendatar / tidak menentu; isyarat kurang boleh dipercayai.
- Trend ≤ –7 → rejim menurun yang kuat, lilin merah gelap.
- Trend volum > 0 → aktiviti meningkat / berterusan, pergerakan lebih cenderung “nyata” dan berterusan.
- Trend volum < 0 → penyertaan berkurang, risiko lebih tinggi pergerakan palsu, tidak menentu, atau pembalikan.
Ringkasan
Ulasan pelanggan
5 | 0 % | |
4 | 100 % | |
3 | 0 % | |
2 | 0 % | |
1 | 0 % |


