설명
유동성 히트맵 - 전문 다중 시간대 피벗 분석
고급 유동성 시각화로 거래를 혁신하세요. 이 강력한 지표는 10개의 서로 다른 시간대에서 동시에 피벗 포인트를 분석하여 기관 유동성 구역을 드러내며, 스마트 머니가 위치할 가능성이 높은 지점을 정확히 보여주는 동적 히트맵을 생성합니다.
작동 원리
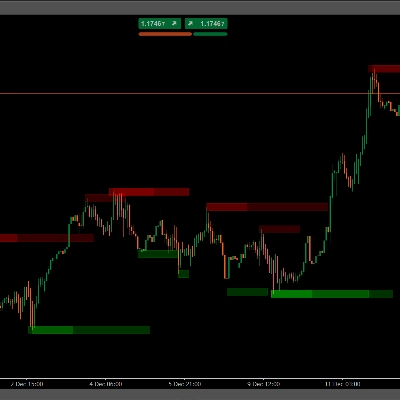
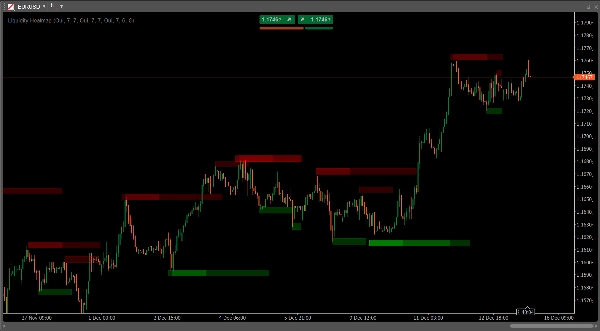
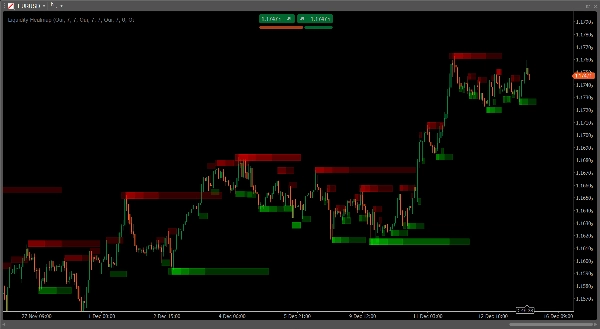
이 지표는 여러 시간대(15분, 30분, 1시간, 2시간, 4시간, 일간, 8시간, 3일, 주간, 월간)의 피벗 고점과 저점을 감지하고 각 피벗 수준에 반투명 구역을 겹쳐 표시합니다. 서로 다른 시간대의 여러 피벗이 모이는 곳에서는 구역이 쌓이고 색상이 짙어져 차트에서 가장 강력한 유동성 수준을 나타내는 "히트 시그니처"를 만듭니다.
주요 특징
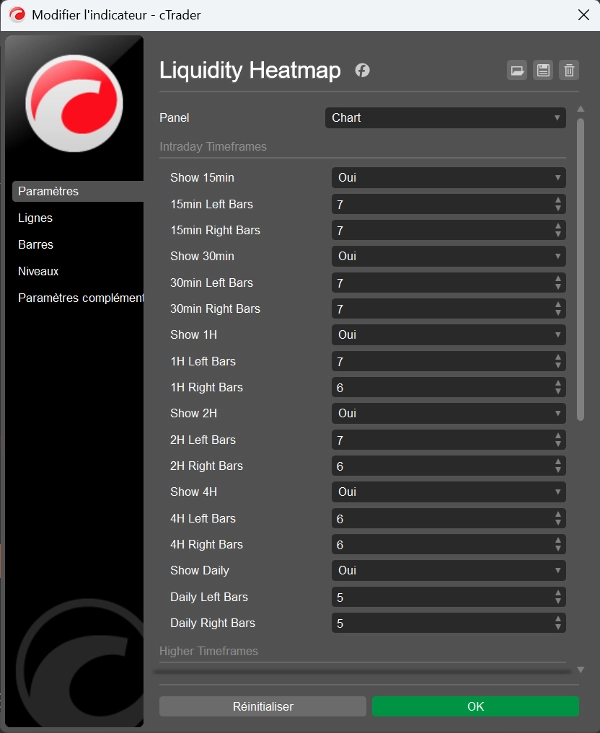
- 10개의 맞춤형 시간대: 15분 단기부터 월간 장기까지 동시에 분석
- 지능형 밀도 매핑: 겹치는 구역이 자동으로 더 어두운 영역을 만들어 유동성 집중을 표시
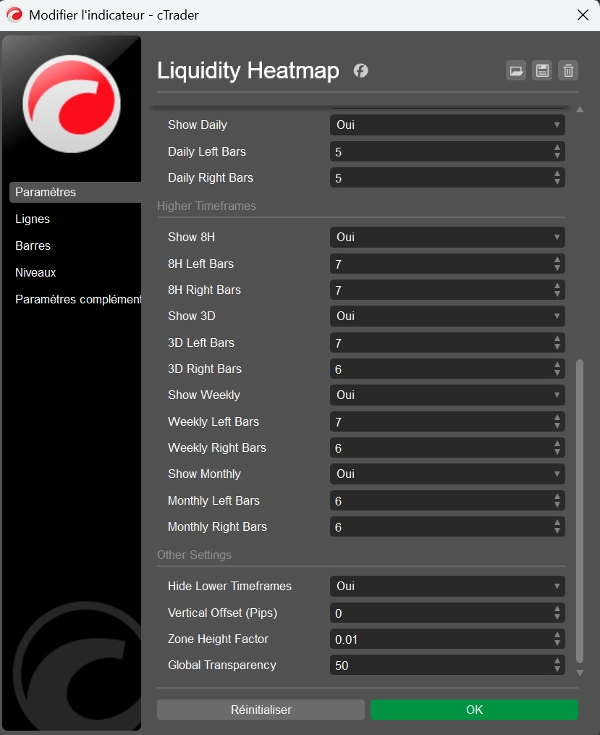
- 완전 조정 가능한 피벗 감지: 각 시간대별로 좌우 바(2-20)를 독립적으로 설정 가능
- 적응형 시각화: 차트 확대/축소에 따라 구역 높이가 자동 조정되어 일관된 모습 유지
- 시간 고정 구역: 구역이 생성된 정확한 시간에 고정되어 차트에서 이동하지 않음
- 투명도 조절 가능: 차트 스타일에 맞게 전역 투명도(0-255) 조절 가능
- 스마트 시간대 필터링: 현재 차트 뷰에 따라 낮은 시간대를 숨기는 옵션
- 수직 오프셋 제어: 핍 단위 조정으로 구역 위치 미세 조정 가능
- 별도 색상 코딩: 피벗 고점(저항)은 빨간색, 피벗 저점(지지)은 녹색 구역
적합 대상
- 유동성 풀을 식별하는 스마트 머니 컨셉(SMC) 트레이더
- 기관 수준을 추적하는 ICT 방법론 추종자
- 고확률 반전 구역을 찾는 스윙 트레이더
- 일중 유동성 포착을 식별하는 스캘퍼
- 여러 시간대에서 일치점을 찾는 모든 트레이더
거래 활용법
히트맵은 손절매가 집중된 위치와 기관 주문이 있을 가능성이 높은 구역을 보여줍니다. 이 구역을 활용하여:
- 유동성 스윕과 반전을 예측하세요
- 강력한 지지/저항 일치점을 식별하세요
- 유동성 포착 후 최적 진입점을 찾으세요
- 핵심 유동성 구역 너머에 전략적 손절매를 설정하세요
- 유동성 소모를 관찰하여 돌파 유효성을 확인하세요
이 지표가 돋보이는 이유
단일 시간대 수준만 보여주는 기본 피벗 지표와 달리, 이 히트맵은 10개 시간대의 데이터를 동시에 집계하여 시장 구조를 포괄적으로 보여줍니다. 밀도 시각화는 가장 중요한 수준을 즉시 보여주며, 구역이 어두울수록 더 많은 시간대가 해당 유동성 수준에 동의함을 의미합니다.
성능 최적화
스마트 오브젝트 관리를 통해 시간대별 최대 500개의 바를 효율적으로 처리하여 모든 시간대를 활성화해도 원활한 차트 성능을 보장합니다.
간편한 설정
최적화된 기본 설정으로 즉시 설치하고 거래를 시작하거나, 모든 매개변수를 맞춤 설정하여 특정 전략과 거래 스타일에 맞출 수 있습니다.
유동성 분석을 향상시키고 기관 주문 흐름의 통찰력으로 거래하세요. 가격이 무작위로 움직이지 않고 유동성으로 움직인다는 것을 이해하는 트레이더에게 완벽한 도구입니다.
요약
Key features include customizable pivot detection parameters for each timeframe, adaptive zone visualization that scales with chart zoom, and separate color coding for resistance (red) and support (green) zones. The indicator also offers adjustable transparency, vertical offset control, and smart timeframe filtering to hide lower timeframes based on the current chart view.
This tool is suitable for traders using Smart Money Concepts, ICT methodology, swing trading, scalping, or any strategy requiring multi-timeframe liquidity analysis. It helps identify clusters of stop losses and institutional orders to anticipate liquidity sweeps, reversals, strong support/resistance levels, optimal entry points, strategic stop losses, and breakout confirmations.
Liquidity Heatmap efficiently processes up to 500 bars per timeframe with optimized object management, ensuring smooth performance. It supports various markets including Forex, Crypto, Stocks, Indices, and Commodities. The indicator comes with optimized default settings and full customization options to fit different trading styles.
고객 리뷰
5 | 100 % | |
4 | 0 % | |
3 | 0 % | |
2 | 0 % | |
1 | 0 % |


!["[Stellar Strategies] Smart ADX" 로고](https://cdn.ctrader.com/image/webp/af13b084-b6f6-41db-b7bc-c7e688b57b05_36929)


