
Penerangan
TeoriaCutrim adalah penunjuk lapisan statistik yang direka untuk mengukur tingkah laku pasaran terkini melalui taburan lilin dan analisis volatiliti. Daripada meramalkan arah, ia menyediakan data objektif mengenai apa yang pasaran baru sahaja lakukan dalam tetingkap lilin yang boleh dikonfigurasikan.
Data Pasaran yang Dianalisis
Penunjuk ini menilai bilangan lilin terkini yang ditetapkan pengguna (tempoh Lookback) dan mengekstrak:
- Bilangan dan peratusan lilin bullish (tutup > buka)
- Bilangan dan peratusan lilin bearish (tutup < buka)
- Perbezaan antara dominasi bullish dan bearish
- Julat purata lilin (dalam pips)
- Julat lilin semasa (dalam pips)
- Jumlah julat harga sepanjang tetingkap yang dianalisis
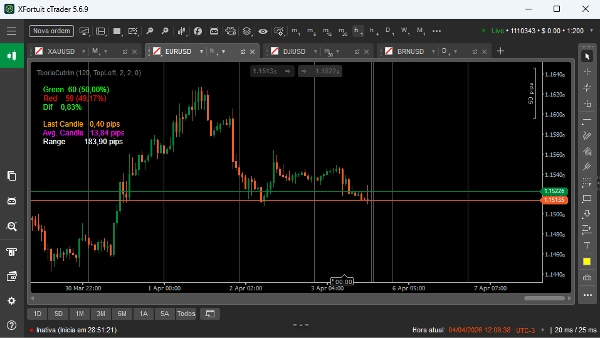
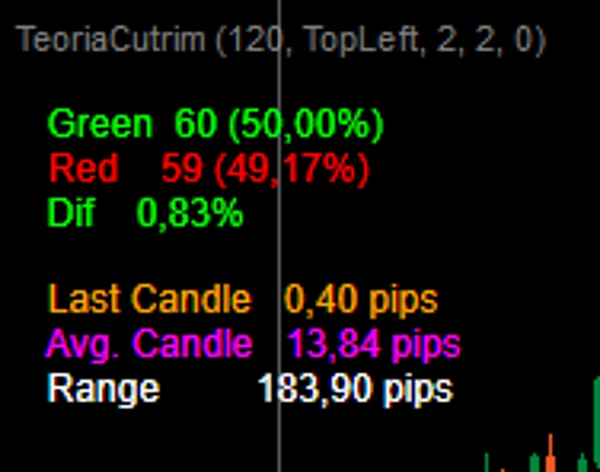
Output Visual dan Tafsiran
Penunjuk memaparkan metrik utama terus pada carta:
- Hijau: jumlah lilin bullish dan peratusan
- Merah: jumlah lilin bearish dan peratusan
- Dif: perbezaan mutlak antara peratusan bullish dan bearish
- Lilin Terakhir: saiz lilin semasa dalam pips
- Purata Lilin: saiz purata lilin dalam tetingkap yang dipilih
- Julat: jarak antara tinggi tertinggi dan rendah terendah dalam tetingkap
Tafsiran adalah mudah:
- Bilangan lilin bullish yang lebih tinggi menunjukkan tekanan menaik terkini
- Bilangan lilin bearish yang lebih tinggi menunjukkan tekanan menurun terkini
- Perbezaan rendah (Dif) menunjukkan keseimbangan atau rawak
- Saiz purata lilin yang meningkat menunjukkan volatiliti yang berkembang
- Julat total yang besar menunjukkan pengembangan pasaran, manakala julat kecil menunjukkan pemampatan
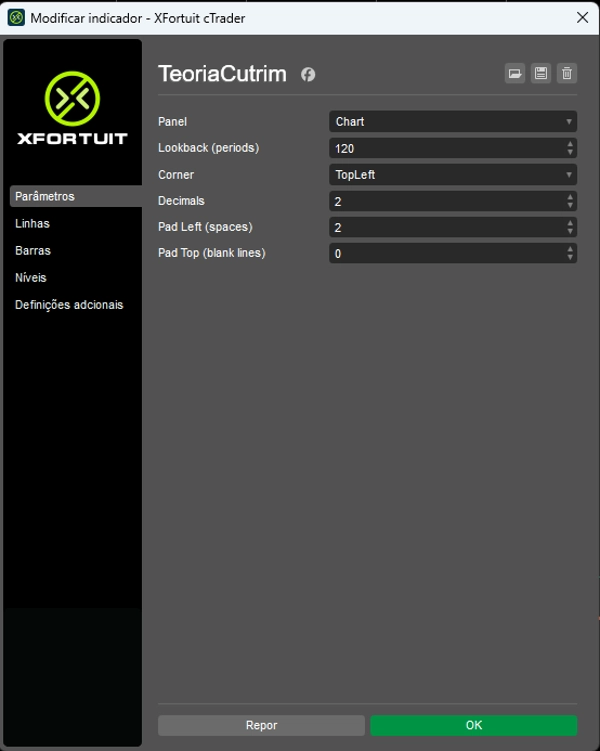
Parameter Utama
- Lookback: bilangan lilin yang digunakan untuk analisis (boleh laras sepenuhnya)
- Corner: kedudukan skrin paparan data
- Decimals: bilangan tempat perpuluhan yang dipaparkan
- Pad Left / Pad Top: pelarasan jarak visual
Kes Penggunaan
TeoriaCutrim paling baik digunakan sebagai alat konteks, bukan penjana isyarat. Aplikasi tipikal termasuk:
- Mengukur ketidakseimbangan statistik sebelum memasuki perdagangan
- Mengenal pasti pengembangan atau pengecutan volatiliti
- Menapis perdagangan berdasarkan tingkah laku lilin terkini
- Menyokong strategi kuantitatif atau berasaskan kebarangkalian
Pengguna Sasaran
Penunjuk ini direka untuk pedagang yang bergantung pada data, statistik, dan analisis objektif daripada pengenalan corak subjektif. Sesuai untuk pedagang diskresionari dan sistematik.


