present
Zarejestruj się i otrzymaj 50 $ zniżki na pierwszy zakup
Trading product for RegimeVisualizer Wskaźnik Flag Volume, image 1
RegimeVisualizer
Wskaźnik
Wersja 1.0, Jul 2026
Windows, Mac
Trading product for RegimeVisualizer Wskaźnik Flag Volume, image 2
Trading product for RegimeVisualizer Wskaźnik Flag Volume, image 3
Trading product for RegimeVisualizer Wskaźnik Flag Volume, image 4
Trading product for RegimeVisualizer Wskaźnik Flag Volume, image 5
Od 11/01/2025
14.87M
Wolumen transakcji
1.06M
Zysk w pipsach

Opis

The problem with regime indicators: they change their minds.

Most regime indicators "learn" from the data while they run. You know the result: the history looks beautiful, because the labels of past bars were silently rewritten after the future arrived. This has a name — repainting — and it is the cardinal sin of any analysis tool: it looks reliable precisely because it erases its own mistakes.

Regime Visualizer makes a single promise: it never repaints.

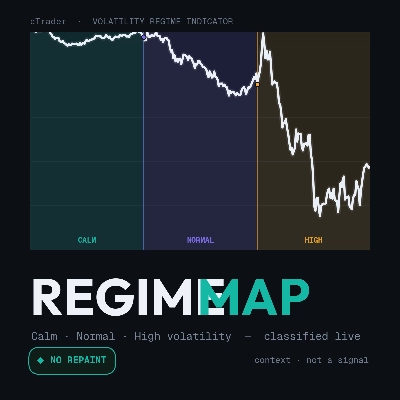
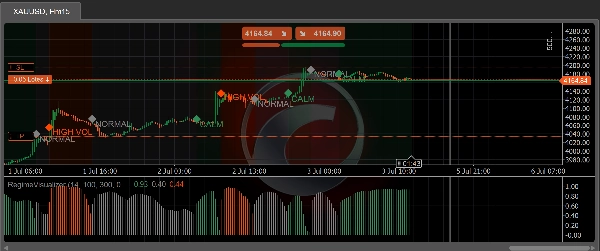
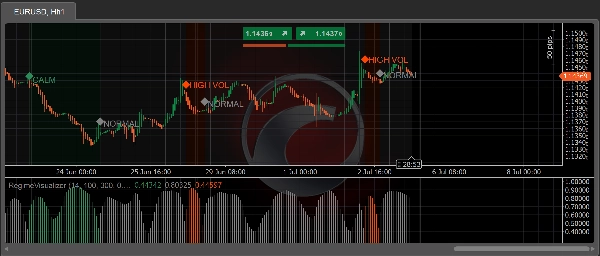
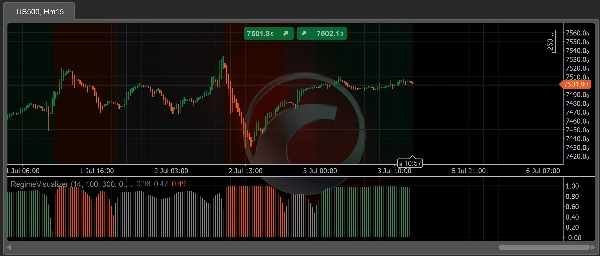
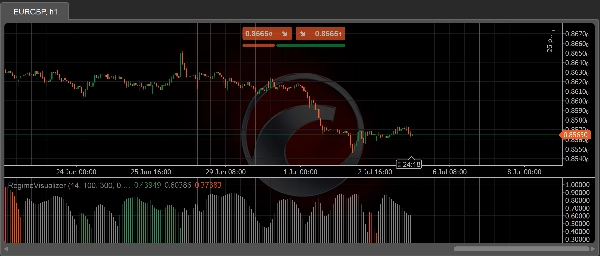
Every bar is classified into one of three volatility regimes — Calm, Normal or High — at the moment it closes. That label is final. It is never recalculated, smoothed or retroactively corrected. The screenshot you take today shows the same thing that was on the screen live, bar by bar. Deterministic: same data, same picture, on every run.

What you see on the chart:

  • 🎨 Colored background per regime segment, right on the price chart
  • 📊 Confidence histogram (0–1) in a separate panel — the filtered probability of the active regime, in the regime's color
  • 🔷 Transition marker — icon + label on the bar where the regime changes
  • Each layer toggles on/off independently, with configurable colors

What it is NOT (read before installing):

  • ❌ Not a trading signal. It never tells you to buy or sell.
  • ❌ No performance promise. Volatility regime does not predict profit — this indicator makes context readable, nothing more. What you do with it is your responsibility.
  • ❌ Not adaptive. There is no online learning — on purpose: "learning while running" is exactly what makes regime indicators repaint.

How it works (for those who want to know):

A 3-state hidden Markov model (HMM) with fixed parameters runs on normalized ATR (ATR(14) / 100-bar ATR average — dimensionless, so it works on any instrument and timeframe). Inference is forward filtering only — it uses nothing but data up to the close of the current bar, with no Viterbi and no backward smoothing (the classic sources of repainting). A hysteresis layer with thresholds and a minimum dwell time turns the flickering argmax into a stable read.

Honest about its limits:

  • The first 300 bars (warmup) stay unlabeled — the indicator does not pretend to know what it does not know yet.
  • The forming bar gets no label — it is classified when it closes. That is the price of never repainting, and we pay it in front of you.

For cBot developers:

The indicator exposes the public RegimeCode series (0 = Calm, 1 = Normal, 2 = High, −1 = warmup) for consumption via Indicators.GetIndicator<RegimeVisualizer>(). Non-repainting volatility context, ready to plug into your logic.

Validation (tested, not claimed):

The non-repaint property was verified by a harness that reprocessed 100,000 real bars across 201 incremental windows — 10.1 million label comparisons, zero divergence — plus bit-identical determinism across runs.

Free. Context — not a signal.

Podsumowanie

Profil wskaźnika
Kategoria wskaźnika
Wolumen
Typ wyjścia
Wizualizacja
Wymagania dotyczące danych
Tylko słupki
Obsługiwane sygnały
Zmienność

Dyskusja

Opinie klientów

0.0
Opinie: 0
Opinie klientów
Ten produkt nie ma jeszcze opinii. Wypróbowałeś(-aś) go już? Bądź pierwszy(-a) i powiedz o tym innym!

Częste pytania

Flag
Volume
Market Structure
Supply & Demand
Risk Dashboard
ATR
Liquidity Grab
Produkty dostępne za pośrednictwem cTrader Store, w tym boty handlowe, wskaźniki i wtyczki, dostarczane są przez deweloperów zewnętrznych i udostępniane wyłącznie w celach informacyjnych oraz w celu zapewnienia dostępu technicznego. cTrader Store nie jest brokerem i nie zapewnia doradztwa inwestycyjnego, nie udziela spersonalizowanych rekomendacji ani nie gwarantuje przyszłych wyników.

Możesz także polubić

Wskaźnik
Volume
Order Block
+3
Map market structure, order blocks, liquidity and key zones with an interactive cTrader dashboard.
Wskaźnik
Key Levels
Liquidity Grab
+2
The levels you mark each morning, drawn and followed: PDH/PDL, weekly, monthly, sessions, equal highs/lows.
Wskaźnik
Key Levels
MarkeeFX Grid Key Level Indicator
Wskaźnik
SMC
Forex
+5
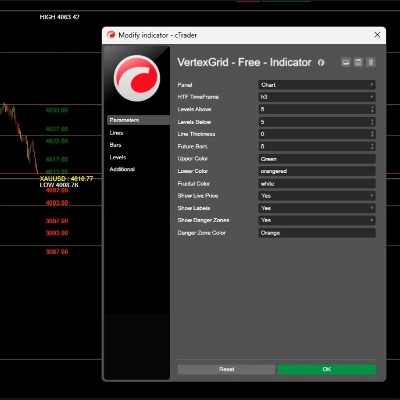
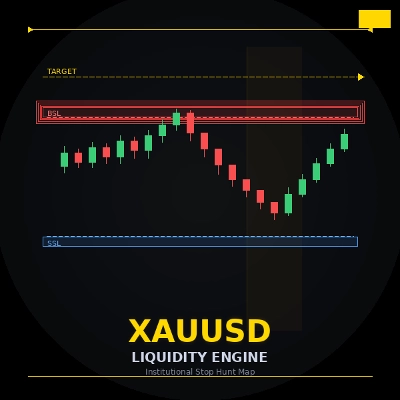
ICT liquidity engine for Gold: maps stop clusters, scores zones & projects the next target. Now with 4 ICT killzones.
Wskaźnik
Forex
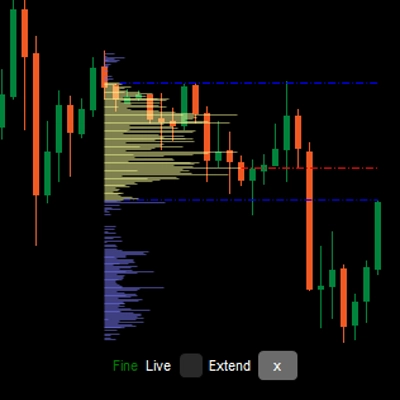
Flexible Volume Profile, designed with performance in mind.
Wskaźnik
Forex
BTCUSD
+11
FREE PRICE ACTION INDICATOR. Good for beginners struggling with trend bias.
Wskaźnik
Indices
Breakout
+1
You can use the cTrader Pivot Points Pro indicator to find a good pullback entry in a trend
Wskaźnik
AI
SMC
+16
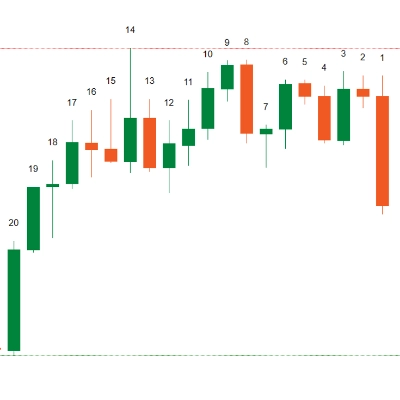
Automate candle numbering for any N-bars and plot the High/Low of the last N periods. Fully customizable & Tab-toggle.
Wskaźnik
Market Structure
Stop guessing which trading session you in, with Sessions indicator sessions are in your finger tips like a pro
Wskaźnik
Doji
Engulfing
+1
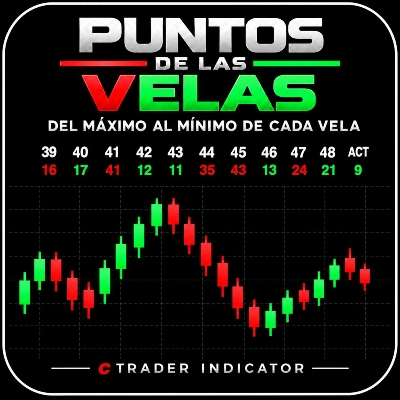
Mide en puntos la distancia entre el Máximo y el Mínimo alcanzados por cada vela, incluida la vela actual.
Wskaźnik
ATR
SMC
+15
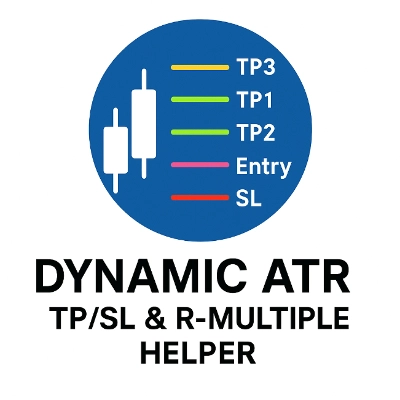
Plot ATR-based SL and 1R/2R/3R TPs instantly for any trade, with clear R-multiple risk mapping.
Wskaźnik
ATR
BOS
+5
Market structure with BOS and CHoCH, order blocks, and retest buy/sell arrows with entry, stop and two targets
Wskaźnik
SMC
Forex
+5
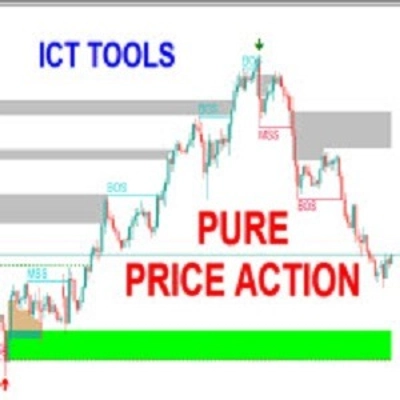
Pure Price Action ICT Tools
Wskaźnik
Imbalance
Fair Value Gap
+4
Fair Value Gap scanner with live fill telemetry, 50% CE lines, 4 mitigation rules, and a 3-stage native alert system.
Wskaźnik
Volume
Moving Average
MULTI-TIMEFRAME ROLLING STANDARD DEVIATION TRADING SIGNAL - Smart Volatility Breakout System
Wskaźnik
ATR
Key Levels
+1
Explore 88 harmonic price-pattern variants with interactive chart controls and geometric reference levels.
Wskaźnik
VWAP
Forex
+5
Dynamic Swing Anchored VWAP
Wskaźnik
Bollinger
ADXR, KDJ, SineWave, Bollinger Band Volatility and AEOscillator.

Cena

Od 11/01/2025
14.87M
Wolumen transakcji
1.06M
Zysk w pipsach