
Penerangan
Penunjuk Nilai Rekursif Intrinsik
Gambaran Keseluruhan
The Intrinsic Recursive Value adalah penunjuk tersuai yang menggunakan pengiraan kekuatan relatif rekursif sepanjang beberapa tempoh untuk mengenal pasti tren pasaran intrinsik. Ia menentukan tahap harga utama di mana kekuatan tren mencapai tahap kritikal, menawarkan pandangan mengenai kemungkinan pembalikan dan pengesahan tren. Konsep Intrinsic Recursive Value adalah berdasarkan idea bahawa momentum pasaran dan kekuatan tren boleh diperhalusi secara rekursif dengan menerapkan beberapa lapisan analisis tindakan harga. Pendekatan rekursif ini membantu mengenal pasti keadaan bullish dan bearish yang mendalam yang mungkin terlepas pandang oleh penunjuk berasaskan harga tradisional.
Zon Perdagangan Bullish & Bearish
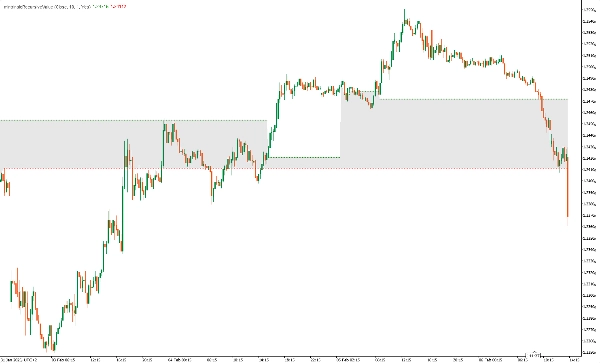
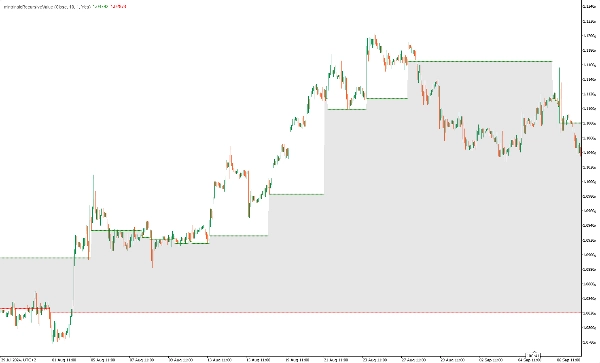
- Zon Perdagangan Bullish: Zon ini terbentuk apabila nilai rekursif intrinsik mengesahkan kekuatan bullish yang berterusan. Ia berlaku apabila semua pengiraan kekuatan relatif rekursif menunjukkan nilai berterusan di atas keseimbangan, mencadangkan momentum naik yang kuat. Zon perdagangan bullish membantu pedagang mengenal pasti titik masuk panjang yang berpotensi dan kawasan sokongan dinamik di mana harga mungkin terus meningkat.
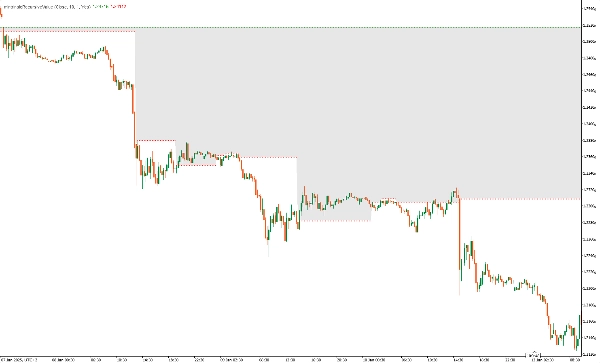
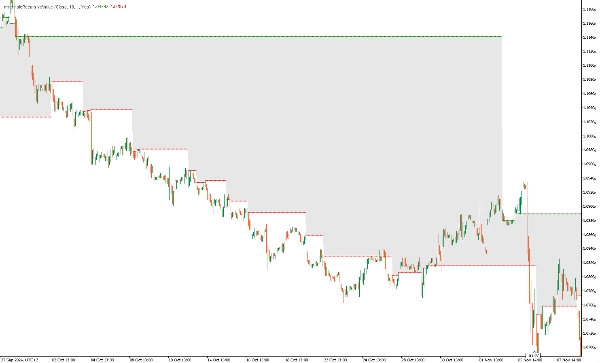
- Zon Perdagangan Bearish: Zon ini ditubuhkan apabila nilai rekursif intrinsik mengenal pasti kekuatan bearish yang berterusan. Apabila semua nilai kekuatan relatif rekursif berada di bawah keseimbangan, ia menandakan tren menurun yang berterusan, memberikan peluang kepada pedagang untuk masuk posisi pendek dan menentukan tahap rintangan dinamik di mana harga mungkin terus menurun.
Output Penunjuk
- outIntrinsicRecursiveLong : Memaparkan tahap panjang intrinsik apabila kekuatan bullish dikesan.
- outIntrinsicRecursiveShort: Memaparkan tahap pendek intrinsik apabila kekuatan bearish dikesan.
Penggunaan
- Pengesahan Tren: Membantu mengenal pasti tren bullish atau bearish yang kuat apabila semua tempoh kekuatan relatif selaras.
- Pengesanan Pembalikan: Menandakan titik perubahan potensi apabila nilai intrinsik berubah.
- Tahap Sokongan & Rintangan: Nilai intrinsik bertindak sebagai tahap sokongan dan rintangan dinamik.
Strategi Perdagangan Contoh
- Masuk Panjang: Masuk perdagangan panjang apabila tahap panjang intrinsik ditetapkan dan tindakan harga mengesahkan momentum bullish, ini bermakna harga berada di atas nilai keseimbangan (komponen hijau penunjuk).
- Masuk Pendek: Masuk perdagangan pendek apabila tahap pendek intrinsik ditetapkan dan tindakan harga mengesahkan momentum bearish, ini bermakna harga berada di bawah nilai keseimbangan (komponen merah penunjuk).
- Strategi Keluar: Gunakan hentian jejak atau ketiadaan tahap intrinsik untuk keluar dari perdagangan
Nota
- Penunjuk ini direka untuk strategi mengikuti tren dan berfungsi terbaik dalam pasaran yang sedang tren.
- Ia boleh digabungkan dengan penunjuk lain seperti penunjuk momentum untuk pengesahan perdagangan pencetus.
Kesimpulan
The Intrinsic Recursive Value Indicator adalah alat yang berkuasa untuk pedagang yang ingin meningkatkan analisis tren menggunakan pengiraan kekuatan relatif rekursif. Dengan mengenal pasti tahap harga utama dengan tren berkemungkinan tinggi, penunjuk ini menyediakan pandangan berharga mengenai arah pasaran dan peluang perdagangan yang berpotensi.


