


Penerangan
Profil Isipadu Rigid membahagikan tetingkap pandangan anda kepada bilangan tahap harga yang tetap dan menunjukkan berapa banyak isipadu yang didagangkan pada setiap satu, dibahagikan kepada tekanan pembelian dan penjualan.
APA YANG DILUKIS
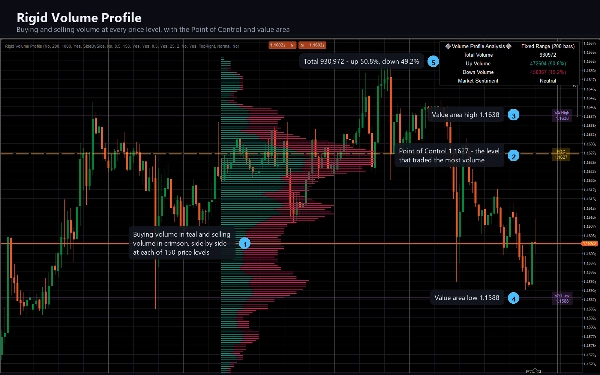
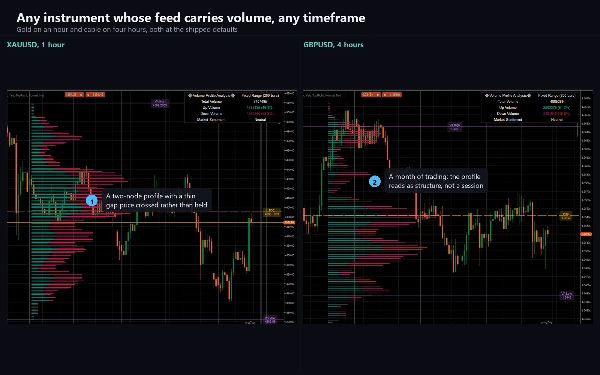
Histogram mendatar di sebelah tindakan harga, dibina daripada N bar terakhir. Bar setiap tahap dibahagikan kepada isipadu bullish (daripada bar yang ditutup naik) dan isipadu bearish (daripada bar yang ditutup turun), supaya anda dapat melihat bukan sahaja di mana dagangan berlaku tetapi pihak mana yang melakukannya. Bar yang ditutup tanpa perubahan membahagikan isipadunya secara sama rata antara kedua-duanya.
Garis Titik Kawalan putus-putus menandakan tahap harga yang paling banyak didagangkan isipadunya dalam tetingkap, dilabel dengan harga tepatnya.
Dua garis kawasan nilai membatasi tahap yang merangkumi 70% isipadu tetingkap, setiap satu dilabel.
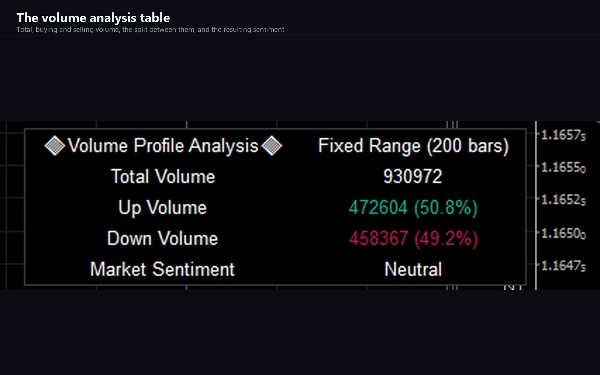
Jadual analisis isipadu melaporkan jumlah, isipadu naik dan turun dengan peratusan, dan bacaan sentimen berdasarkan pihak yang menguasai.
CARA MENGGUNAKANNYA
Profil isipadu menerangkan di mana dagangan sebenarnya berlaku, bukan di mana harga hanya bergerak. Tahap yang menyerap banyak isipadu adalah tahap yang ramai peserta peduli; bahagian profil yang nipis adalah julat harga yang pasaran lalui dengan cepat.
Baca Titik Kawalan sebagai pusat graviti tetingkap. Baca kawasan nilai sebagai julat di mana kebanyakan urusan dilakukan. Baca jurang nipis antara dua nod berat sebagai zon yang harga cenderung melintasi daripada berlama-lama. Perhatikan pihak mana yang menguasai tahap apabila harga kembali kepadanya.
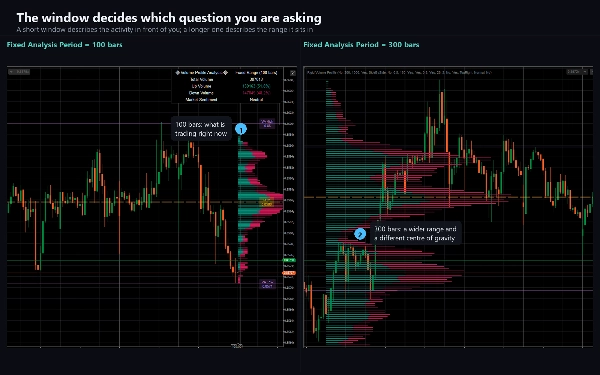
Tetingkap adalah pilihan anda dan gambaran berubah dengannya, jadi pilih pandangan yang sesuai dengan keputusan yang anda buat. Profil 100 bar menjawab soalan yang berbeza daripada profil 500 bar.
TETAPAN UTAMA
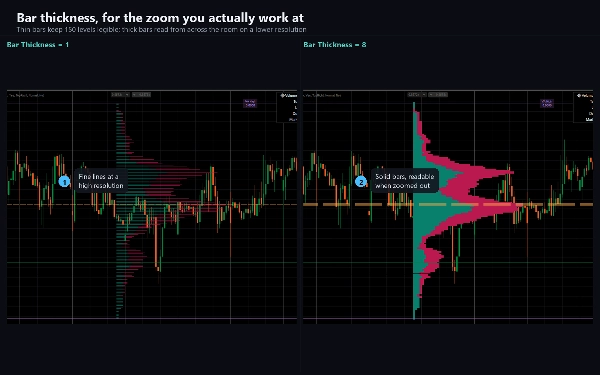
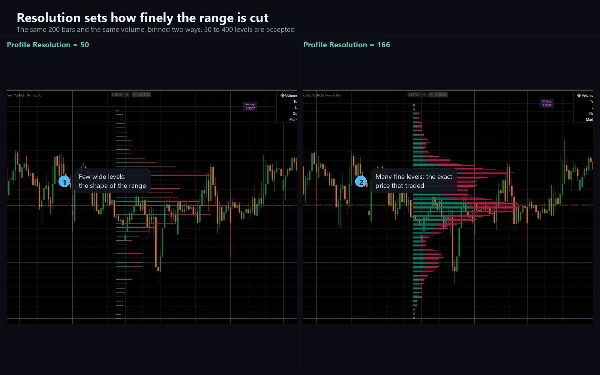
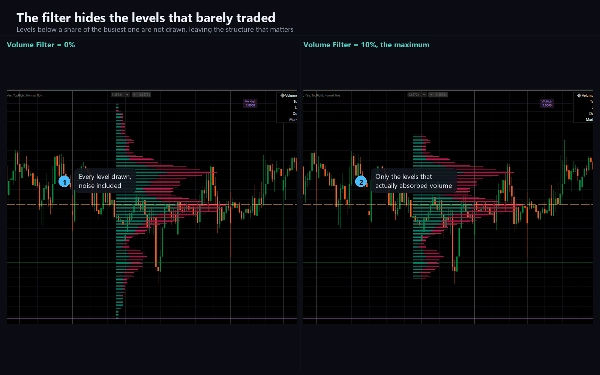
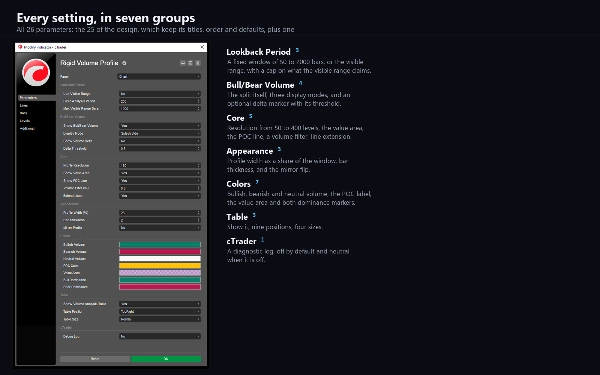
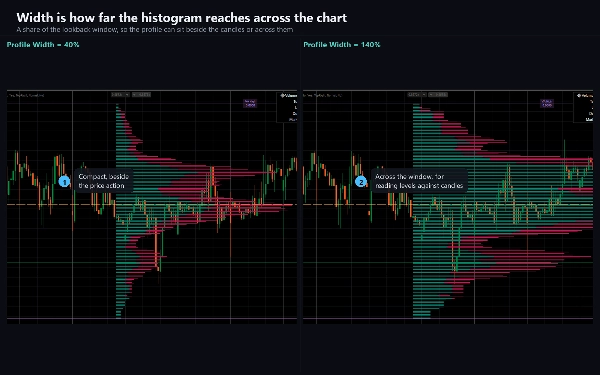
Tempoh Analisis Tetap menetapkan pandangan dalam bar, 50 hingga 2000. Resolusi Profil menetapkan berapa banyak tahap harga julat dibahagikan, 50 hingga 400; tahap yang lebih sedikit dibaca seperti profil klasik, lebih banyak memberikan butiran halus. Mod Paparan menawarkan Sisi ke Sisi, Bertindih dan Berpisah. Lebar Profil mengskala histogram sebagai peratusan pandangan. Penapis Isipadu menyembunyikan tahap di bawah peratusan tahap paling sibuk. Papar Delta Isipadu menambah penanda di mana satu pihak jelas menguasai. Setiap warna boleh disesuaikan, dan jadual analisis boleh dipindahkan ke mana-mana daripada sembilan posisi atau dimatikan.
Gunakan Julat Terlihat menukar pandangan kepada bar yang sedang di skrin dan bukannya kiraan tetap.
JENIS PENUNJUK DAN TETINGKAP
Lapisan carta. Ia dilukis pada carta harga itu sendiri, bukan dalam panel berasingan.
JANGKA MASA DAN INSTRUMEN
Mana-mana jangka masa. Ia paling berguna dalam hari dagangan, dari M5 ke H4, di mana taburan isipadu sesi adalah objek yang bermakna.
Berfungsi pada mana-mana instrumen yang alirannya membawa isipadu. Pada forex itu adalah isipadu tik, bilangan kemas kini harga setiap bar, yang merupakan proksi untuk aktiviti dan bukan saiz dagangan. Pada indeks dan CFD komoditi sesetengah broker menyediakan isipadu pertukaran sebenar, dan profil lebih bermakna di situ. Pada instrumen tanpa isipadu langsung, tiada apa yang dilukis.
SIAPA YANG SESUAI
Pedagang yang sudah bekerja dengan profil isipadu dan mahukan satu dengan grid tetap yang boleh laras dan pembahagian pembelian dan penjualan yang jelas, bukan profil sesi tetap.
PERCUBAAN
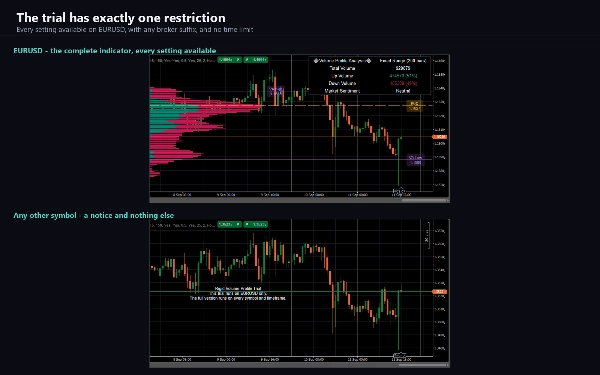
Edisi percubaan disertakan dengan produk ini. Ia adalah penunjuk lengkap dengan setiap tetapan tersedia, terhad kepada EURUSD. Versi penuh menghapuskan sekatan itu dan tidak menambah apa-apa lagi.
NOTA TEKNIKAL DAN HAD
Profil dikira semula pada setiap tik bar yang terbentuk, jadi Titik Kawalan dan kawasan nilai bergerak dalam bar dan menetap apabila ia ditutup. Ini adalah reka bentuk. Tiada apa di sini adalah isyarat bar tutup.
Pada Resolusi Profil melebihi 166 tahap harga terendah tidak dilukis. Ini adalah had reka bentuk yang sengaja, yang menempah kumpulan objek lukisan tetap dan menggunakan tiga setiap tahap harga; togol Papar Garis POC dan Papar Kawasan Nilai masing-masing membebaskan satu. Kekalkan Resolusi Profil pada 166 atau ke bawah untuk melihat profil penuh.
Kawasan nilai dibina dengan mengatur tahap mengikut isipadu dan mengambilnya mengikut urutan itu sehingga 70% dicapai, kemudian melaporkan harga tertinggi dan terendah di antara mereka. Oleh itu biasanya lebih lebar daripada kawasan nilai yang dibina dengan berjalan keluar dari Titik Kawalan.
Kerana profil dibina daripada isipadu broker anda, dua broker tidak akan menghasilkan profil yang sama daripada pasaran yang sama.
AccessRights adalah Tiada: penunjuk tidak meletakkan pesanan, tidak mengubah apa-apa, dan tidak membaca data akaun.
SOKONGAN
Dokumentasi yang merangkumi setiap parameter, tetapan yang mengejutkan orang, dan panduan penyelesaian masalah disertakan dengan produk. Soalan dialu-alukan melalui tab Perbincangan; laporan berguna menyenaraikan simbol, broker, jangka masa, versi cTrader dan tetapan yang diubah daripada lalai.
Perdagangan melibatkan risiko. Prestasi lalu tidak menjamin keputusan masa depan.
Ringkasan
Users can customize the lookback period (50 to 2000 bars), profile resolution (50 to 400 levels), display mode (side by side, stacked, split), profile width, and volume filtering. The profile updates dynamically on every tick of the forming bar. It supports any timeframe and instruments with volume data, including tick volume for forex and real exchange volume for some CFDs. The indicator is intended for traders familiar with volume profiles seeking detailed buying and selling pressure insights on a fixed grid rather than session-based profiles. A trial version is available with full features restricted to EURUSD.













![Logo "[Stellar Strategies] VBO"](https://cdn.ctrader.com/image/webp/f034c012-94d4-445a-a01b-febd1cdedaef_36944)














