Mô tả
Giới thiệu
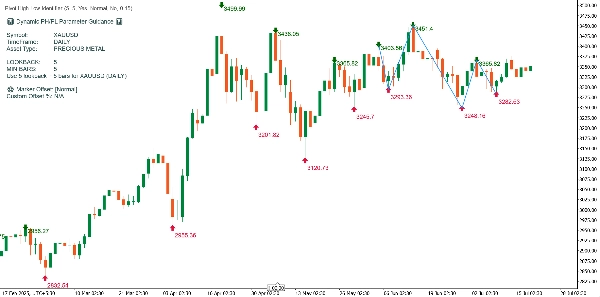
Biểu đồ hiển thị sử dụng chỉ báo cTrader tùy chỉnh "Cải tiến Hiển thị PH/PL". Công cụ này xác định động các đỉnh và đáy quan trọng (PH/PL), vẽ các đường xu hướng zigzag giữa chúng, và tạo ra một bảng hướng dẫn thông tin dựa trên ký hiệu, khung thời gian và loại tài sản được phát hiện. Dưới đây là phân tích chi tiết cách chỉ báo xử lý và chú thích biểu đồ mẫu.
Các yếu tố chính được minh họa trên biểu đồ
1. Đỉnh xoay (PH) và Đáy xoay (PL)
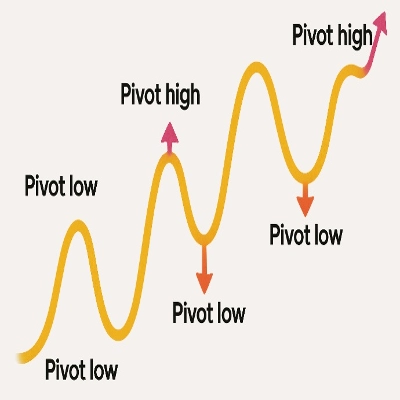
- Đỉnh xoay: Được đánh dấu bằng mũi tên xanh lá hướng xuống và giá cao tương ứng phía trên các thanh.
- Đáy xoay: Được đánh dấu bằng mũi tên đỏ hướng lên và giá thấp tương ứng phía dưới các thanh.
- Logic sử dụng: Một PH xảy ra khi giá cao của một thanh cao hơn giá cao của 'lookback' thanh trước và sau nó; tương tự, một PL được định nghĩa cho giá thấp.
- Cấu hình Lookback: Trong mã và biểu đồ của bạn, lookback là 5, cho phép phát hiện swing mạnh mẽ phù hợp với dữ liệu hàng ngày.
2. Nhãn giá
- Hiển thị có thể bật/tắt: Nhãn giá gắn với mỗi điểm PH/PL có thể được hiển thị hoặc ẩn thông qua các tham số của chỉ báo. Trong ví dụ này, giá được hiển thị để rõ ràng.
- Tự động điều chỉnh vị trí: Vị trí nhãn được điều chỉnh thuật toán sử dụng khoảng cách tối ưu (đặt sẵn hoặc tùy chỉnh), đảm bảo văn bản không chồng lên nến hoặc các phần tử biểu đồ.
3. Đường xu hướng Zigzag động
- Hiển thị: Các đường zigzag màu xanh nối các điểm PH/PL gần đây và quan trọng nhất, làm nổi bật chuỗi các biến động giá lớn.
- Mục đích: Giúp nhà giao dịch theo dõi trực quan các xu hướng thay đổi và sự chuyển động động lượng trong khoảng thời gian biểu đồ.
4. Bảng hướng dẫn động
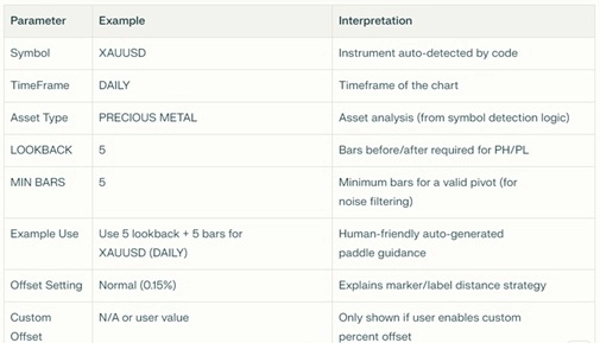
Bảng điều khiển góc trên bên trái tóm tắt các cài đặt chính, kết quả phát hiện và khuyến nghị sử dụng
Cách chỉ báo hoạt động trên biểu đồ này
Giải thích từng bước:
- Xác định Swing:
Chỉ báo quét từng thanh hàng ngày sau khi khởi tạo, so sánh giá cao và thấp trong cửa sổ năm thanh ở mỗi bên để xác định PH và PL. - Đặt dấu hiệu:
PH và PL được đánh dấu bằng mũi tên màu; nhãn giá tương ứng được đặt ở khoảng cách tối ưu để đảm bảo rõ ràng. - Hiển thị xu hướng:
Thuật toán chọn 10 điểm xoay gần nhất (PH/PL, có thể cấu hình) và vẽ các đường màu xanh nối chúng, mô tả các biến động thị trường chính và hỗ trợ nhận diện xu hướng. - Bảng tham số:
Bảng hiển thị xác nhận tự động phát hiện loại tài sản (ở đây: XAUUSD, một "KIM LOẠI QUÝ") và cung cấp cho người dùng các giá trị khuyến nghị tối ưu cho lookback, số thanh tối thiểu, và offset cho sự kết hợp này—tất cả hiển thị trong thời gian ngắn. - Thích ứng thông minh với tài sản:
Nếu bạn áp dụng chỉ báo này cho ký hiệu khác (như forex ngoại lai, tiền điện tử, hoặc chỉ số chứng khoán), bảng hướng dẫn và logic phát hiện sẽ tự động điều chỉnh, đặt lookback và số thanh tối thiểu khuyến nghị phù hợp với hành vi thị trường và khung thời gian cụ thể đó. - Trải nghiệm biểu đồ sạch:
Tất cả các đối tượng đồ họa được vẽ (mũi tên, đường xu hướng, nhãn giá, văn bản tĩnh) được xóa và vẽ lại mỗi lần tính toán để tránh lộn xộn. Chỉ báo luôn phủ thông tin lên biểu đồ giá, không bao giờ ở bảng điều khiển riêng biệt.
Những điểm cần lưu ý khi giao dịch
- Nhận diện cấu trúc swing: Bạn có thể nhanh chóng đọc được chuỗi và độ lớn của các biến động thị trường.
- Lập kế hoạch vào/ra: Các điểm xoay PH/PL có thể dùng cho logic trailing stop hoặc dự đoán các điểm đảo chiều tiềm năng.
- Sử dụng phổ quát: Bất kể tài sản hay khung thời gian, chỉ báo tự điều chỉnh và giải thích các khuyến nghị của nó.
- Hình ảnh rõ ràng, chuyên nghiệp: Sự lộn xộn về giá và chồng chéo nhãn được giảm thiểu nhờ điều chỉnh thông minh.
Tóm tắt
Biểu đồ này chứng minh sức mạnh và sự rõ ràng của Cải tiến Hiển thị PH/PL. Chỉ báo cung cấp cho nhà giao dịch các tín hiệu trực quan ngay lập tức về các điểm xoay chính, hướng và kích thước các biến động, cùng hướng dẫn ngữ cảnh cụ thể cho công cụ và khung thời gian. Mọi thứ đều tự động, cập nhật và có thể tùy chỉnh cho bất kỳ tài sản hoặc môi trường thị trường nào.
Lưu ý: Do giới hạn trong cTrader, chỉ báo hiển thị tùy chọn đặt chỉ báo trên bảng điều khiển mới nhưng điều đó sẽ không áp dụng được vì chỉ báo không thể xem trên bảng điều khiển mới do kích thước và chức năng của nó. Ngoài ra, nếu giá được in quá xa mũi tên xoay và gây nhầm lẫn cho người dùng thì người dùng có thể tự chọn hiển thị giá hoặc không.
Nếu bạn cần tùy chỉnh thêm, như tín hiệu âm thanh/cảnh báo tại các điểm xoay, hoặc lọc động cho các biến động nhỏ hơn, cứ hỏi!


