Opis
Wskaźnik CRT (Candle Range Theory) to potężne narzędzie analityczne zaprojektowane specjalnie dla traderów stosujących metodologię ICT (Inner Circle Trader). Ten wskaźnik identyfikuje kluczowe formacje świecowe związane z CRT, które są niezbędne do zrozumienia ruchów rynku i akcji cenowej.
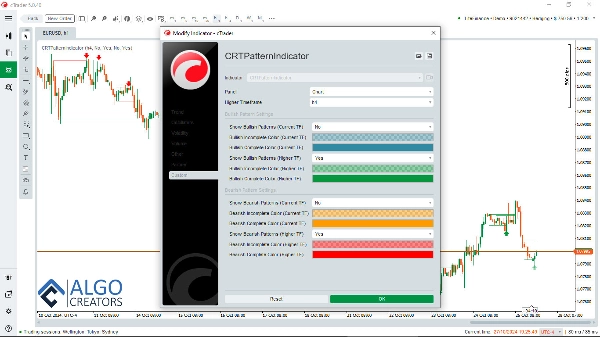
Wskaźnik CRT dla cTrader wyposażony jest w funkcje wieloczasowe, pozwalające traderom na przeglądanie wzorców CRT z wyższych interwałów czasowych (HTF) podczas pracy na niższych interwałach (LTF). Ta funkcjonalność jest kluczowa dla uzyskania wglądu w ogólną strukturę rynku i poprawy decyzji handlowych.
Ruch cen i ICT Power of 3 (AMD):
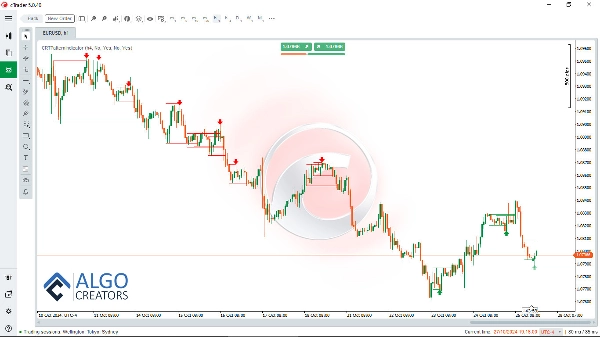
Wskaźnik CRT upraszcza analizę ruchów cen oraz rozpoznawanie wzorców związanych z Power of 3 ICT (Anatomy of Market Dynamics - AMD).
LTF CRT w ramach HTF CRT:
Dzięki łatwemu identyfikowaniu kluczowych punktów wsparcia i oporu, traderzy mogą analizować akcję cenową z dużo większą przejrzystością. Dodatkowo wskaźnik CRT podkreśla wzorce HTF i LTF, pomagając traderom poruszać się w dynamice różnych cykli rynkowych.
używaj wskaźnika CRT z innymi koncepcjami handlowymi:
Łączenie CRT z innymi koncepcjami handlowymi, takimi jak FVGs, order blocks oraz turtle soup zwiększa prawdopodobieństwo identyfikacji udanych transakcji.
Co więcej, wskaźnik CRT stanowi nieocenione uzupełnienie dla Smart Money Assistant – zaawansowanego narzędzia zaprojektowanego, aby wspierać traderów smart money w kluczowych analizach rynku i podejmowaniu decyzji. Połączone, te dwa wskaźniki tworzą kompleksowy zestaw narzędzi handlowych, który zwiększa zdolność tradera do analizy i działania.
Pobierz Smart Money Assistant: https://ctrader.com/algos/show/3956/
Aby dodatkowo wzmocnić strategie handlowe, wskaźnik FVG Finder może być używany razem z wskaźnikiem CRT. To narzędzie wykrywa luki wartości godziwej (Fair Value Gaps - FVG) na wykresie, które w połączeniu z sygnałami CRT zwiększają szanse na udane transakcje.
Pobierz wskaźnik FVG finder: https://ctrader.com/algos/show/3877/
Integrując te wskaźniki, traderzy mogą stworzyć solidny system wykorzystujący układy o wysokim prawdopodobieństwie, co pozwala skutecznie poruszać się po rynkach i optymalizować wyniki handlowe.
Pobierz wskaźnik CRT z alertami:: www[dot]AlgoCreators[dot]net
Dzięki wskaźnikom CRT, Smart Money Assistant i FVG Finder w swoim zestawie narzędzi, możesz maksymalizować zrozumienie trendów rynkowych i poprawić ogólną efektywność handlu, co czyni je niezbędnym zasobem dla traderów pragnących osiągnąć sukces w stylu handlu ICT.
Podsumowanie
It simplifies the recognition of price movements related to ICT’s Power of 3 (Anatomy of Market Dynamics - AMD) and highlights critical support and resistance levels. By displaying both higher and lower timeframe patterns, it helps traders interpret market cycles more clearly.
The CRT indicator can be combined with other trading concepts such as Fair Value Gaps (FVGs), order blocks, and turtle soup patterns to enhance trade identification. It also complements the Smart Money Assistant indicator, providing a comprehensive toolkit for smart money trading analysis.
Additionally, pairing the CRT indicator with the FVG Finder, which detects Fair Value Gaps, can improve the probability of successful trades. Together, these tools support the development of robust trading strategies aligned with the ICT style.
Opinie klientów
5 | 85 % | |
4 | 15 % | |
3 | 0 % | |
2 | 0 % | |
1 | 0 % |