
Opis
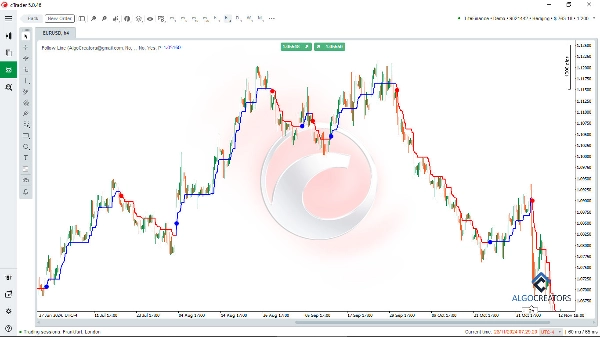
Wskaźnik Follow Line to potężny wskaźnik cTrader do analizy technicznej, pomagający traderom w identyfikacji optymalnych punktów wejścia i wyjścia na rynkach finansowych. Łącząc Bollinger Bands i wskaźnik ATR, filtruje trendy i dostarcza wiarygodne sygnały kupna i sprzedaży.
Dzięki temu wskaźnikowi możesz łatwo dostrzec wzrostowe lub spadkowe trendy rynkowe i podążać za sygnałami o wysokim poziomie pewności.
Traderzy mogą łączyć wskaźnik Follow Line z zaawansowanymi narzędziami, takimi jak cTrader Smart Money Assistant oraz oscylatory typu MACD, aby wzbogacić swoją analizę i potwierdzić wejścia w transakcje.
Jego konfigurowalne ustawienia i alerty w czasie rzeczywistym czynią go cennym dodatkiem do każdej strategii handlowej, umożliwiając użytkownikom realizację udanych transakcji z pewnością i precyzją.
Kluczowe cechy:
- Wykrywanie trendów: Użyj Follow Line, aby zidentyfikować bycze lub niedźwiedzie trendy rynkowe.
- Sygnały kupna/sprzedaży: Wyświetlaj dokładne sygnały kupna i sprzedaży oparte na wybiciach Bollinger Bands.
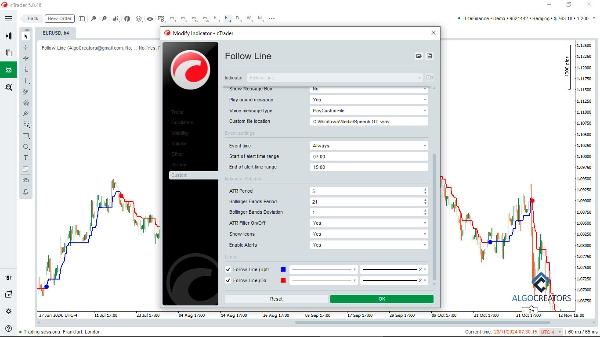
- Filtr ATR: Opcja włączenia lub wyłączenia filtra ATR dla zwiększenia dokładności sygnałów.
- Konfigurowalne ustawienia: Dostosuj okres Bollinger Bands, odchylenie standardowe i okres ATR.
- Wizualna reprezentacja: Pokazuj sygnały na wykresie za pomocą intuicyjnych ikon (strzałki lub linie).
- Alerty: Otrzymuj natychmiastowe powiadomienia za każdym razem, gdy pojawi się sygnał kupna lub sprzedaży.
Ten wskaźnik jest wysoce konfigurowalny, pozwalając traderom na dostosowanie okresów Bollinger Bands, odchyleń standardowych oraz ustawień ATR do ich strategii. Wskazówki wizualne i natychmiastowe alerty czynią go przyjaznym dla użytkownika i skutecznym zarówno w skalpowaniu, jak i handlu swingowym. Dzięki funkcjom takim jak wykrywanie trendów, zarządzanie ryzykiem i konfigurowalne ustawienia, wskaźnik Follow Line jest idealny dla traderów forex, kryptowalut i akcji, którzy chcą poprawić swoją analizę techniczną i wyniki handlowe.
Idealny do precyzyjnego identyfikowania okazji rynkowych!
Podsumowanie
Users can customize settings such as Bollinger Bands period, standard deviation, and ATR period to align with their trading strategies. The indicator visually represents signals on the chart using intuitive icons like arrows or lines and provides real-time alerts when signals occur. It supports various trading styles, including scalping and swing trading, and is suitable for forex, cryptocurrency, and stock markets.
The Follow Line indicator can be combined with other tools like the cTrader Smart Money Assistant and MACD oscillators to confirm trade entries and enhance analysis. Its customizable features and alert system assist traders in identifying precise market opportunities and managing risk effectively.
Opinie klientów
5 | 60 % | |
4 | 20 % | |
3 | 20 % | |
2 | 0 % | |
1 | 0 % |


![Logo „[Stellar Strategies] MARSI Signal Plotter”](https://cdn.ctrader.com/image/webp/7b2b8da6-8f8e-4646-8d4a-4710c516c01e_25567)


