
50 percent
지표
버전 1.0, Aug 2025
Windows, Mac
5.0
리뷰: 2

설명
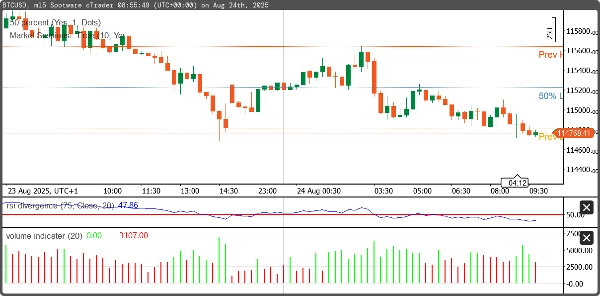
이 cBot은 이전 세션의 최고가와 최저가를 자동으로 감지하고 그 사이의 중간값을 계산합니다. 이는 거래자들이 반전 또는 돌파 전략에 자주 사용하는 주요 지지/저항 구역과 시장 균형 수준을 식별하는 데 도움을 주도록 설계되었습니다.
- 이전 일(또는 세션)의 최고가와 최저가를 감지합니다.
- 최고가와 최저가 사이의 중간값을 계산합니다.
- 차트에 최고가, 최저가 및 중간값 수준을 표시합니다.
요약
지표 프로필
고객 리뷰
5.0
리뷰: 2
5 | 100 % | |
4 | 0 % | |
3 | 0 % | |
2 | 0 % | |
1 | 0 % |
고객 리뷰
August 29, 2025
The screen feels less crowded, but the final call still needs say no.
August 20, 2025
상담
자주 묻는 질문(FAQ)
트레이딩 봇, 지표, 플러그인 등 cTrader Store에서 제공되는 상품은 제3자 개발자에 의해 제공되며, 이는 단순히 정보 및 기술적 접근을 목적으로 제공된 것입니다. cTrader Store는 중개인이 아니며, 투자 조언, 개인별 추천 또는 향후 성과에 대한 어떠한 보장도 제공하지 않습니다.
이 작성자의 상품 더 보기


가격
가입일 14/05/2025
10.1M
거래량
81.44K
핍 수익
205
무료 설치