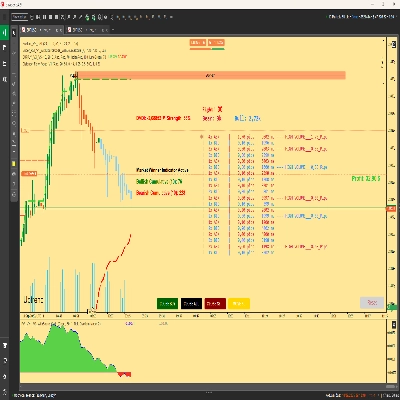
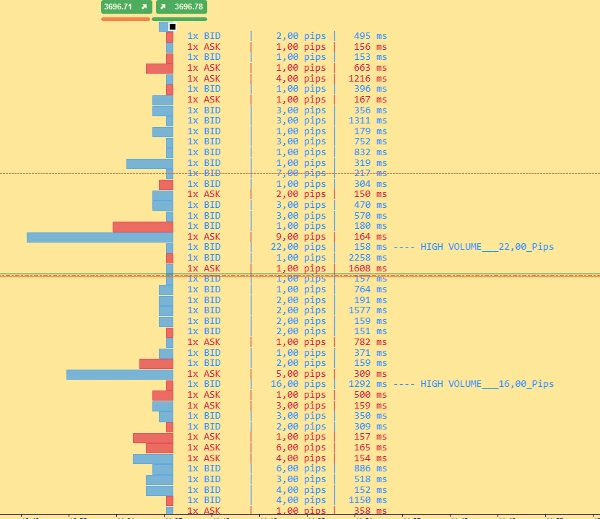
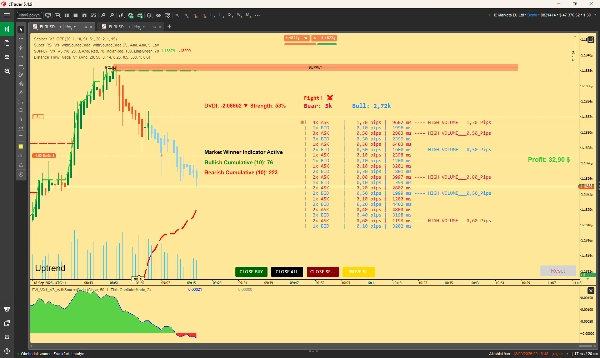
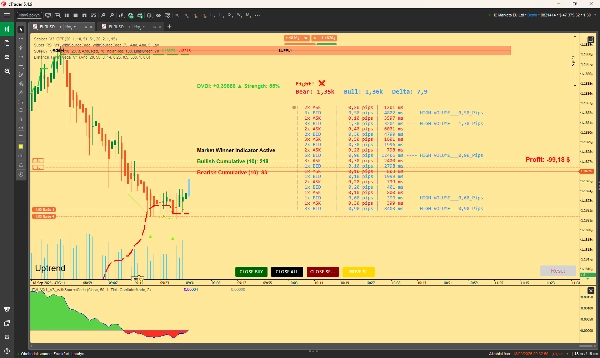
Wskaźnik
NAS100
NZDUSD
Breakout
XAUUSD
Commodities
Forex
Signal
EURUSD
GBPUSD
BTCUSD
Indices
Prop
Stocks
Crypto
USDJPY
Scalping
ORDERFLOW_SKIA_Plynuly
Logo „ORDERFLOW_SKIA_Plynuly”
18/09/2025
249
Desktop
Przesłany obraz „ORDERFLOW_SKIA_Plynuly”Przesłany obraz „ORDERFLOW_SKIA_Plynuly”Przesłany obraz „ORDERFLOW_SKIA_Plynuly”

This Indicator will show you Direction, Distance, and Time; Use this indicator exactly at support and resistance zones to see who the winner is. You will see many high volume texts , while there is bid high volume and bear high volume, do not enter, wait until it calms down and watch where the price is going , the winner is a Bear or Bull? You will see :-) . This indicator will not give you pure buy sell signals, it will give you much more, give to it a time , watch what is happening on chart and watch my indicator and you will soon realize they way to earn some cash is not that hard. Have a nice day. If this Indicator proves useful , i have also much better and polished version with much more signals, and informations. Latest version + Source = $5000 Usd

0.0
Opinie: 0
Opinie klientów
Ten produkt nie ma jeszcze opinii. Wypróbowałeś(-aś) go już? Bądź pierwszy(-a) i powiedz o tym innym!
Więcej od tego autora
Cumulative Delta Candles + VolumeProfile
Cumulative delta candles + volume profile
Support Resistance Zones
Support and Resistance.
VolumeProfile_8
Scalpers Volume Profile
DynamicVolumeSupplyDemand
Supply and Demand Zones
Insider_CumulativeDelta
Robust Cumulative delta,Atr and imbalance indicator.
Tape reader
TAPE READER :-)
Wskaźnik
Grid
NAS100
NZDUSD
+17
Institutional Volume Supply Demand
Volume Profile Supply Demand
Wskaźnik
Breakout
BreakOut_Probability_Expo
Break Out Probability Experimental indicator. Credits for this indicator goes to Zeiierman !!!
MTF Candles
Multi Timeframe Candle drawing. Draw Any candles from any timeframe on your chart :-)
Cumulative Delta_noSourceCode
Demo of my main indcator.
Możesz także polubić
Wskaźnik
NAS100
NZDUSD
XAUUSD
+14
Elliott Wave Fib Auto
🚀 Automated Elliott Wave & Fibonacci tool for cTrader. Spot trends, corrections & retracements fast.
Wskaźnik
RSI
Indices
Signal
+2
[Stellar Strategies] Ultimate Trend & Momentum Dashboard
A comprehensive cTrader indicator designed to give you a quick, at-a-glance understanding of market sentiment 📈📉
Wskaźnik
Breakout
Round Number
Plots automatic psychological levels at round-number zones – major structure & liquidity levels.
Wskaźnik
RSI
Breakout
XAUUSD
+6
Fair Value Gap Sessions
identify and highlight temporary market inefficiencies known as "fair value gaps" 🚨 within specific trading Sessions.
E7 BBKG Indicator
E7 BBKG indicator with 80% plus accuracy used to show both, possible reversal and trend.
Wskaźnik
Indices
Prop
Stocks
+3
LT_Ind_SRZones
Automatic Support/Resistance zones from swing points.
Wskaźnik
Indices
Breakout
XAUUSD
+5
Price Action Context Scanner
Smart Price Action Scanner 🔍 Detects engulfing, pin bars & inside bars with trend filter for cleaner entries ✅
Renko 4k Pips
Custom your Renko Brick how do you wish!
FREEE Tradingview Economic Calendar on Chart
Customizable window inside your platform, access to any website Calendar Was Free for early users now -50%
Wskaźnik
RSI
Breakout
Supertrend
Trend Heikin Multi MA
🚀 TrendHeikinMultiMA: Advanced trend detection using Heikin-Ashi smoothing & MAs! Eliminates noise, confirms real trend
Wskaźnik
Indices
E7 BlackScholes Model
Option pricing using the BlackScholes model and the Math.Numerics packages
MAMA CANDLES
This code implements the MESA Adaptive Moving Average (MAMA) indicator, it creates candles based on MAMA calculations.
Wskaźnik
RSI
MACD
SmartBot-MACD & RSI Indicator
This indicator is a combination of MACD and RSI into one. This is perfect fusion and powerful indicator ever.
Za darmo
Wskaźnik
Indices
Prop
Commodities
+3
Period Separator
Period Separator that shows on all timeframes including renko and range bars.
Za darmo
High TF Plotter
Captra High TF Plotter visualizes high timeframe Bar on lower timeframe charts, highlighting with bull/bear colors.
Wskaźnik
Indices
Stocks
Forex
+2
HorizontalSupportResistance
This extraordinary multi-timeframe support and resistance indicator is nothing short of market wizardry.
Wskaźnik
NAS100
NZDUSD
XAUUSD
+11
TSI True Strength Index
Enhance trading with TSI! Use the True Strength Index for clear insights into market momentum and trend strength.
Wskaźnik
Breakout
3 Bar Triangle by Linda Raschke
3 bar triangle = high below 2 day high, low above 2 day low