
Free Smart Money Concepts (SMC) from TradingView
Indikator
3.25K downloads
Version 1.0, Oct 2025
Windows, Mac
5.0
Bewertungen: 8
Beschreibung
- 🔷 Was sind Smart Money Concepts (SMC)?
- SMC ist ein Preisaktionsrahmen, der sich darauf konzentriert, wie institutionelles „Smart Money“ Positionen akkumuliert und verteilt.
- Es ersetzt einfache Muster durch eine logische Karte der Marktstruktur (BOS/CHoCH), Liquidität (EQH/EQL), Order Blocks (OB), Fair Value Gaps (FVG) und Premium-/Discount-Zonen, um wahrscheinliche Fortsetzungen oder Umkehrungen vorherzusehen.
- 🚀 Was dieser Indikator macht
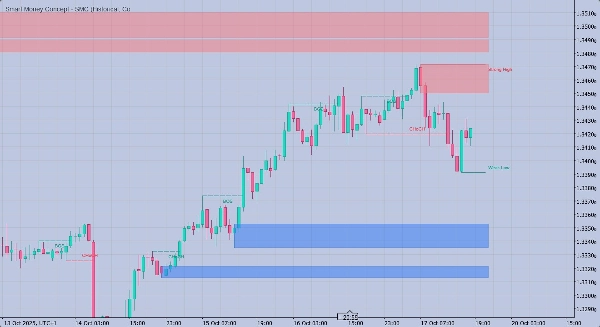
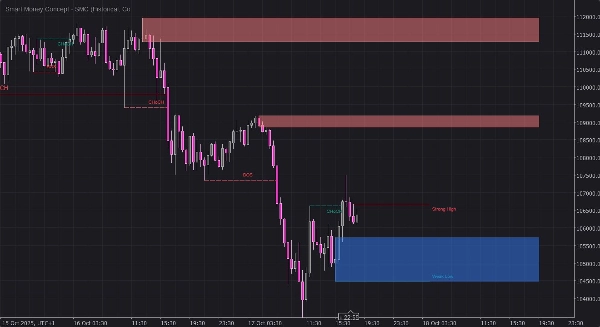
- Erkennt Break of Structure (BOS) und Change of Character (CHoCH) sowohl in Swing- als auch interner Struktur.
- Zeichnet Order Blocks (OB) und Fair Value Gaps (FVG) als halbtransparente Zonen (RGBA-Farben – die Deckkraft ist vollständig benutzersteuerbar).
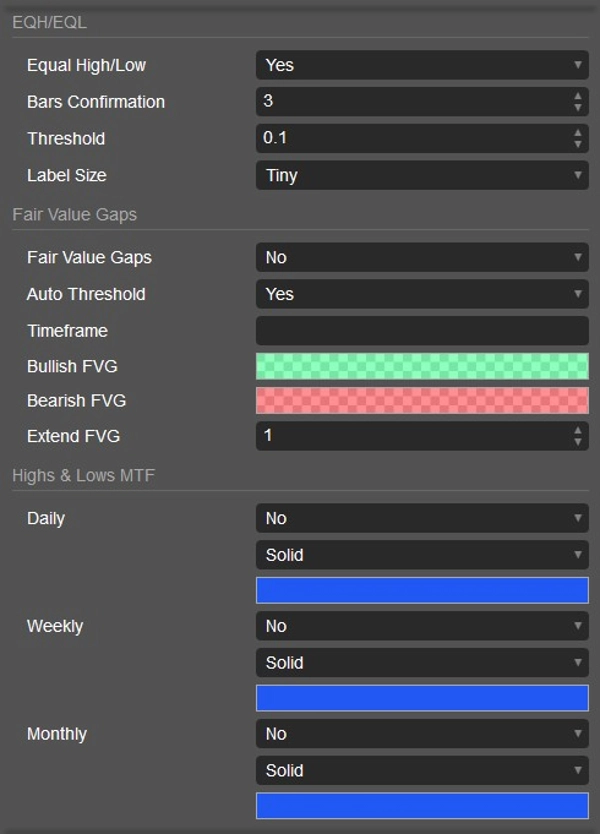
- Markiert Equal Highs/Equal Lows (EQH/EQL), um Liquiditätspools anzuzeigen.
- Beschriftet Starke/Schwache Hochs/Tiefs, damit Sie sehen können, welche Seite wahrscheinlich anvisiert oder geschützt wird.
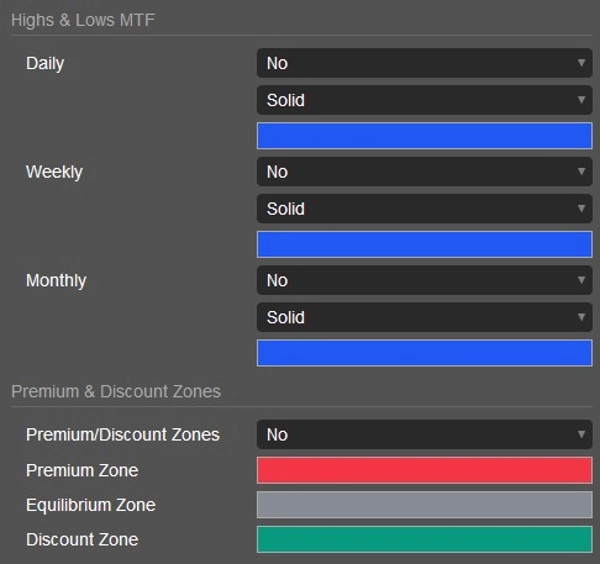
- Zeichnet Premium/Equilibrium/Discount Zonen über den aktuellen Swing-Bereich für Wertbereichskontext.
- Überlagert Tages-/Wochen-/Monatshochs & -tiefs für Multi-Timeframe-Konfluenz.
- Bietet Präsent-/Historische Zeichenmodi und Monochrom-/Farbige Stile.
- 🧭 Wie man es benutzt (praktischer Workflow)
- 1) Zuerst Struktur lesen:
-
- Suchen Sie nach BOS/CHoCH auf Swing- und internen Ebenen, um eine Tendenz festzulegen.
- Ein bullisches BOS + internes BOS signalisiert oft eine Fortsetzung; ein CHoCH warnt vor einer möglichen Umkehr.
- 2) Ungleichgewichte und Blöcke kartieren:
-
- Verwenden Sie FVG als „Effizienz-Ziele“, wo der Preis oft ausbalanciert wird.
- Verwenden Sie OB als wahrscheinliche Milderungszonen, in denen Einstiege entstehen können (z. B. Limit- oder Bestätigungseinstiege).
- 3) Mit Liquidität ausrichten:
-
- Beobachten Sie EQH/EQL für Liquiditäts-Sweeps; der Sweep + BOS ist eine starke SMC-Erzählung.
- Beachten Sie Starke/Schwache Hochs/Tiefs, um einzuschätzen, welche Seite verwundbar ist.
- 4) Konfluenz hinzufügen:
-
- Überprüfen Sie Premium/Discount: Kauf-Setups haben eine höhere Wahrscheinlichkeit im Discount; Verkaufs-Setups im Premium.
- Fügen Sie MTF-Ebenen (D/W/M) und Ihre eigene Sitzungszeit für Präzision hinzu.
- 5) Ausführen und verwalten:
-
- Einstiege: OB-Minderung oder FVG-Füllungen mit Strukturabgleich.
- Stops: jenseits der Ungültigmachung des OB/FVG oder des zuletzt starken Pivot.
- Ziele: gegenüberliegende Liquidität, entgegengesetzter OB/FVG oder Gleichgewicht des Swings.
- ⚙️ Wichtige Einstellungen, die Sie steuern
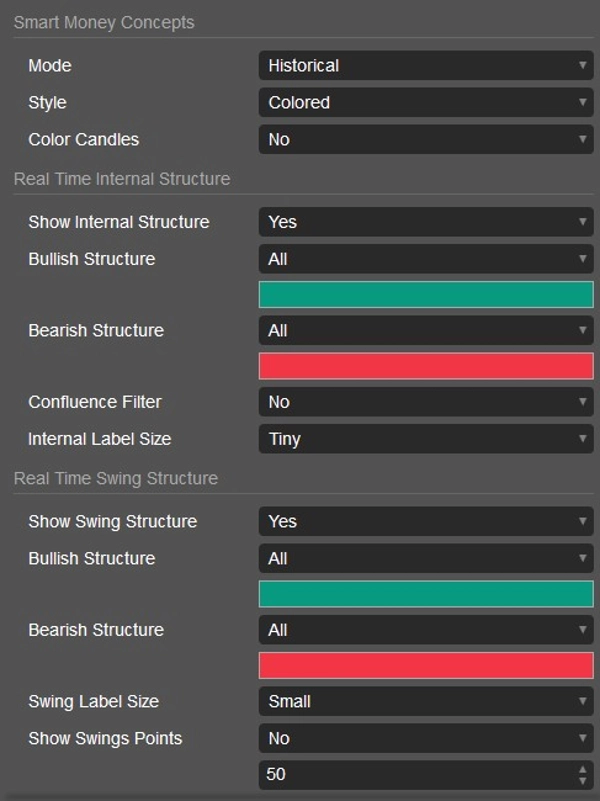
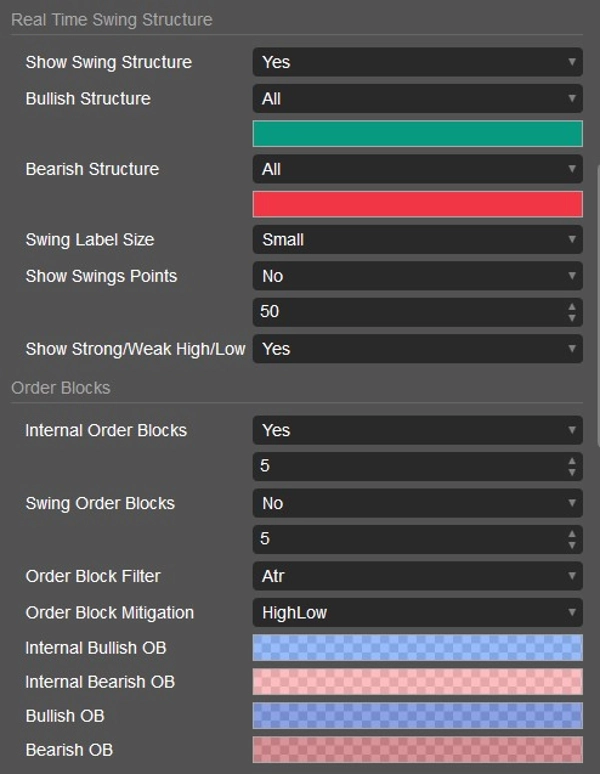
- Modus: Historisch vs Gegenwart (sauberes Echtzeitbild).
- Strukturfilter: Zeigt BOS/CHoCH für Swing vs intern; Beschriftungsgrößen; optionale Konfluenz (Docht-Logik).
- OB/FVG-Farben: Wählen Sie jede RGBA-Farbe; der Alphakanal setzt die Transparenz direkt.
- Anzahlen/Grenzen: Maximale Anzahl sichtbarer OBs; FVG-Erweiterung; EQH/EQL-Empfindlichkeit.
- MTF-Ebenen: Umschalten von Tages-/Wochen-/Monatsebenen und Auswahl der Linienarten.
- Stil: Farbige oder Monochrome, plus optionale Kerzenfärbung nach Trend.
- 🧩 Warum Trader es mögen
- 1:1 Paritätslogik mit dem beliebten TradingView-SMC-Ansatz (BOS/CHoCH, OB/FVG-Parität).
- Saubere Visuals: Zonen und Beschriftungen bleiben lesbar und aktualisieren sich flüssig in Echtzeit.
- Flexibel: funktioniert vom Scalping bis zum Swing-Trading, bei jedem Symbol oder Zeitrahmen, der von cTrader unterstützt wird.
- ✅ Beste Praktiken
- Kombinieren Sie SMC-Kontext mit Risikomanagement und einem klaren Playbook (Einstiegs-, Stopp-, Zielregeln).
- Verwenden Sie Alarme oder Watchlists rund um HTF-Ebenen und Sitzungsöffnungen für qualitativ hochwertigere Bewegungen.
- Validieren Sie stets mit Marktsitzung und Nachrichtenkalender, um zufällige Volatilität zu vermeiden.
- 📌 Hinweise
- Visuals hängen von Broker-Daten ab (Bid-Feeds/Sitzungen können variieren).
- Dieses Tool ist keine Finanzberatung; Trading beinhaltet Risiken. Verwenden Sie es auf einem Demokonto, bevor Sie live gehen.
Zusammenfassung
KI-Zusammenfassung
Free Smart Money Concepts (SMC) indicator for cTrader replicates the TradingView SMC framework, focusing on institutional price action analysis. It identifies key market structure elements such as Break of Structure (BOS) and Change of Character (CHoCH) on both swing and internal levels to help establish trading bias. The indicator visually marks Order Blocks (OB) and Fair Value Gaps (FVG) as semi-transparent zones, highlighting potential entry and mitigation areas. It also detects Equal Highs/Lows (EQH/EQL) to indicate liquidity pools, and labels strong or weak highs and lows to assess market vulnerability.
Additional features include plotting premium, equilibrium, and discount zones within the current swing range for value-area context, and overlaying daily, weekly, and monthly highs and lows for multi-timeframe confluence. Users can customize drawing modes (present or historical), color schemes (monochrome or colored), and opacity levels for OB/FVG zones. The indicator supports flexible use across all symbols and timeframes available in cTrader, suitable for scalping to swing trading.
The workflow involves reading market structure, mapping imbalances and blocks, aligning with liquidity, adding confluence from premium/discount zones and multi-timeframe levels, and executing trades with defined entry, stop, and target rules. Visuals depend on broker data feeds. This tool is intended for analysis and does not provide financial advice.
Indikatorprofil
Kundenbewertungen
5.0
Bewertungen: 8
5 | 100 % | |
4 | 0 % | |
3 | 0 % | |
2 | 0 % | |
1 | 0 % |
Kundenbewertungen
July 6, 2026
May 23, 2026
March 4, 2026
December 11, 2025
November 4, 2025
Superfantastic 3 in one zones, one of the best indicators on here ,and for free. If you cant figure it out after this, you got something wrong with ya :). Nicely done my friend, how did you code it C# or python?
Diskussion
Häufig gestellte Fragen (FAQ)
BTCUSD
Forex
Signal
Breakout
Indices
EURUSD
Commodities
GBPUSD
NZDUSD
Fibonacci
Prop
ZigZag
Scalping
Fair Value Gap
SMC
Crypto
Stocks
XAUUSD
NAS100
ATR
USDJPY
Über den cTrader Store verfügbare Produkte, einschließlich Handelsbots, Indikatoren und Plugins, werden von externen Entwicklern bereitgestellt und nur zu Informations- und technischen Zugriffszwecken verfügbar gemacht. cTrader Store ist kein Broker und erbringt keine Anlageberatung, persönlichen Empfehlungen oder eine Garantie für zukünftige Performance.


Preis
46
Verkäufe
3.96K
Kostenlose Installationen