Deviation Indicator by PrimeQuant
Wskaźnik
Wersja 1.0, Oct 2025
Windows, Mac
5.0
Opinie: 3
Opis
- 📈 Co to jest
Profesjonalny zestaw narzędzi łączący kanały True Deviation, koncepcje Smart Money (lokalne maksima/minima i płynność) oraz bias Elder Impulse, pomagający w wyznaczaniu momentów odwrócenia, przełamań momentum i strukturalnych cofnięć. - 💡 Dlaczego traderzy to kochają
- Wykrywa wysokoprawdopodobne ekstrema do zagrywek fade lub kontynuacji
- Mapuje strukturę (strefy swing) tak, jak obserwują ją instytucje
- Wyróżnia poziomy płynności często celowane przed prawdziwymi ruchami
- Dodaje filtr impulse bias, aby unikać walki z warunkami trendu
- 🧰 Co otrzymujesz
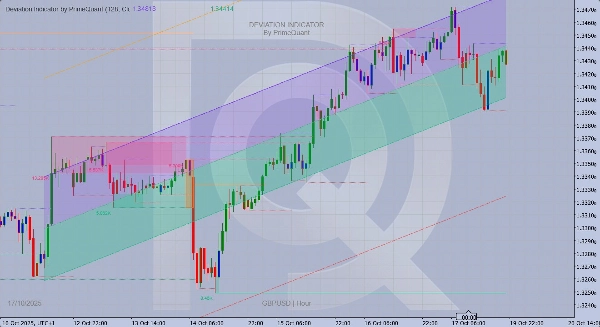
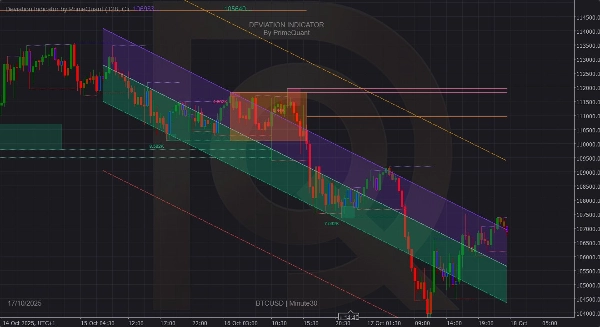
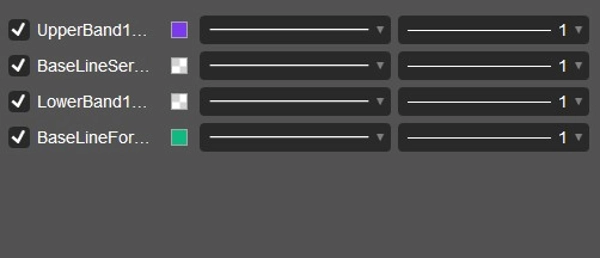
- Adaptacyjne kanały odchylenia: wewnętrzne/zewnętrzne pasma wokół przesuwającej się linii regresji
- Strefy Swing SMC: automatyczne lokalne maksima/minima z opcjonalnym wypełnieniem obszarów
- Poziomy płynności: przerywane poziomy śledzące prawdopodobne strefy zamiatania
- Soczewka wzoru Riemanna: linie średnich zakresów wewnątrz głównych/pomniejszych pudełek
- Bias Elder Impulse: szybka wizualna wskazówka momentum względem trendu
- Czysta paleta: nowoczesne, wysokokontrastowe domyślne ustawienia (przyjazne dla ciemnego i jasnego motywu)
- Znak wodny i informacje: subtelne oznakowanie z odczytem symbolu/interwału czasowego
- 🧭 Jak używać (szybki start)
- Zidentyfikuj ekstrema: Cena dotyka zewnętrznego odchylenia → szukaj odrzutu lub kontrolowanego przełamania.
- Potwierdź strukturę: Sprawdź pobliskie strefy swing (H/L) i płynność—częste są fałszywe wybicia.
- Sprawdź bias: Elder Impulse zielony/czerwony/niebieski, aby się dostosować lub pozostać na uboczu.
- Zaplanuj transakcję:
-
- Rewersja: cofnięcie zewnętrznego pasma do linii bazowej lub środkowej.
- Wybicie: czekaj na zamknięcie poza pasmem + zmianę struktury.
- Zarządzaj ryzykiem: Umieść stop lossy poza swingiem/pudełkiem, skaluj przy linii bazowej lub przeciwnym paśmie.
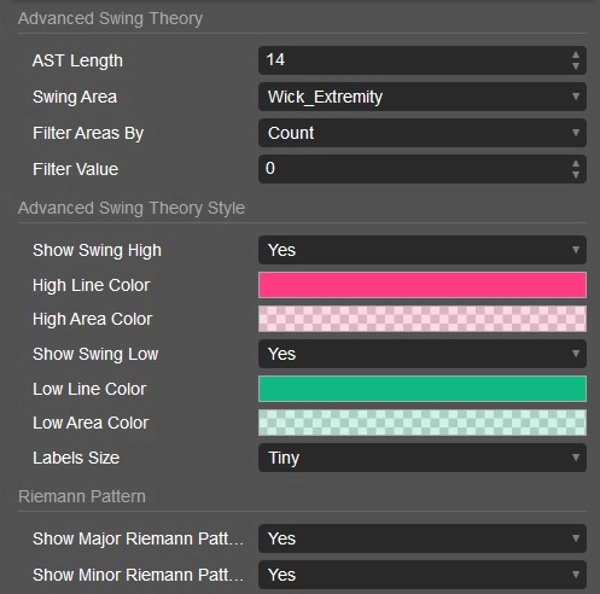
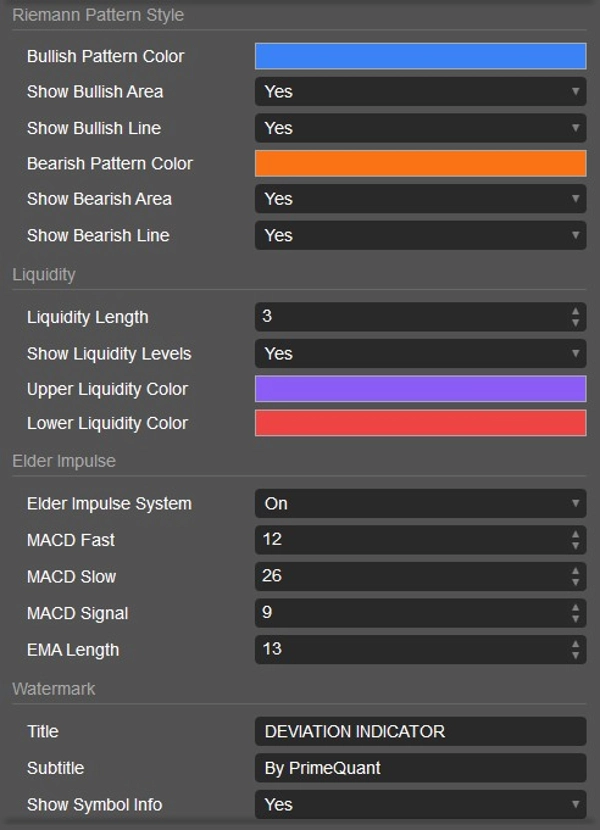
- ⚙️ Kluczowe parametry
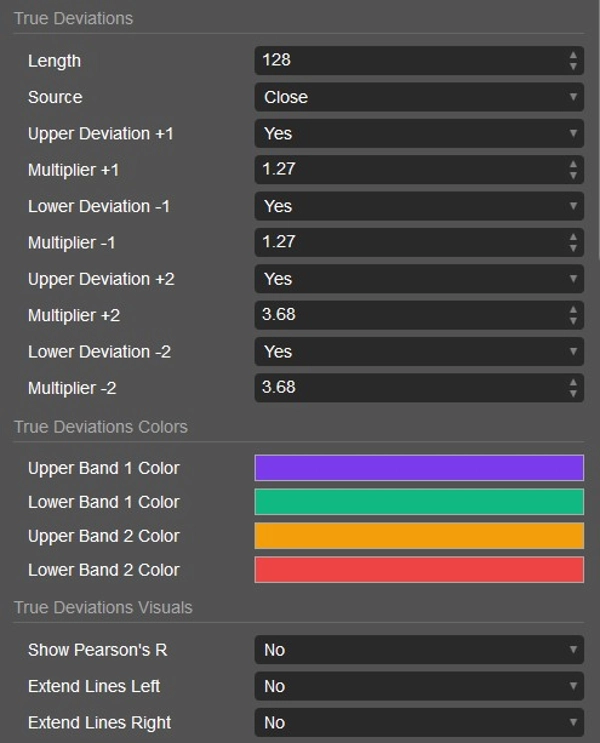
- Długość: okres cofania dla regresji i obliczeń odchylenia (domyślnie 128)
- Źródło: podstawa cenowa (Close, warianty OHLC)
- Mnożniki odchylenia: regulacja czułości wewnętrznego/zewnętrznego pasma
- Tryb strefy swing: ekstremum knota vs pełny zakres świecy
- Filtry: według liczby dotknięć lub zaangażowania wolumenu
- Długość płynności: szerokość pivotu do wykrywania poziomów
- Ustawienia impulsu: wejścia MACD/EMA do kolorowania biasu
- Wizualizacje: kolory, wypełnienia, style linii, tekst znaku wodnego
- 🧪 Pomysły na strategie
- Scalping z powrotem do średniej: Dotknięcie zewnętrznego pasma + przeciwny kolor impulsu → celuj w linię bazową.
- Przełamanie struktury: Zamiatanie płynności przez poziom swing, potem zamknięcie poza wewnętrznym pasmem → jedź do zewnętrznego pasma.
- Kontynuacja cofnięcia: Zielony impuls, cofnięcie do linii bazowej/wewnętrznego pasma przy poprzedniej płynności → wznowienie trendu.
- 🧭 Działa na
Forex, indeksy, surowce, kryptowaluty i akcje; wszystkie interwały od skalpowania po swing. - 👤 Dla kogo jest
Traderzy, którzy chcą jedną wizualną mapę dla ekstremów + struktury + płynności + biasu bez bałaganu. - ⚠️ Zastrzeżenie
To narzędzie wspomagające podejmowanie decyzji, nie porada finansowa. Zawsze testuj na demo i stosuj ścisłe zarządzanie ryzykiem.
Podsumowanie
Profil wskaźnika
Opinie klientów
5.0
Opinie: 3
5 | 100 % | |
4 | 0 % | |
3 | 0 % | |
2 | 0 % | |
1 | 0 % |
Opinie klientów
October 28, 2025
Demo first, then maybe small size if the notes look sane. A small account test feels safer.
October 23, 2025
the only reason it stays interesting is it makes forced ideas less tempting. It needs a boring test before bigger size.
October 20, 2025
RSI 30 and 70 keeps the first run grounded. Thin setups are easier to reject.
Dyskusja
Częste pytania
BTCUSD
Forex
Signal
Breakout
Indices
EURUSD
Commodities
GBPUSD
NZDUSD
Fibonacci
Prop
ZigZag
Fair Value Gap
SMC
Crypto
Stocks
XAUUSD
NAS100
MACD
USDJPY
Produkty dostępne za pośrednictwem cTrader Store, w tym boty handlowe, wskaźniki i wtyczki, dostarczane są przez deweloperów zewnętrznych i udostępniane wyłącznie w celach informacyjnych oraz w celu zapewnienia dostępu technicznego. cTrader Store nie jest brokerem i nie zapewnia doradztwa inwestycyjnego, nie udziela spersonalizowanych rekomendacji ani nie gwarantuje przyszłych wyników.


![Logo „[CB] Pivot Points Pro”](https://cdn.ctrader.com/image/webp/43463c82-67b0-4f10-a4ba-901bba091d81_32594)


Cena
46
Sprzedaż
3.93K
Bezpłatne instalacje