
WAVETREND_withSourceCode
Wskaźnik
Wersja 1.0, Oct 2025
Windows, Mac
5.0
Opinie: 2
Opis
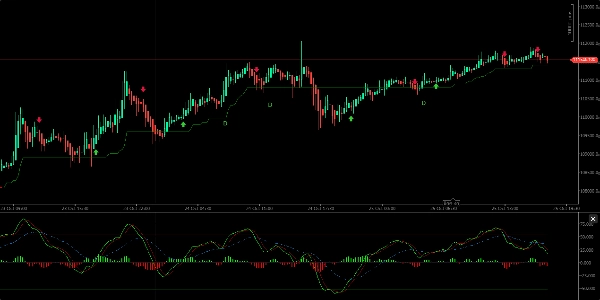
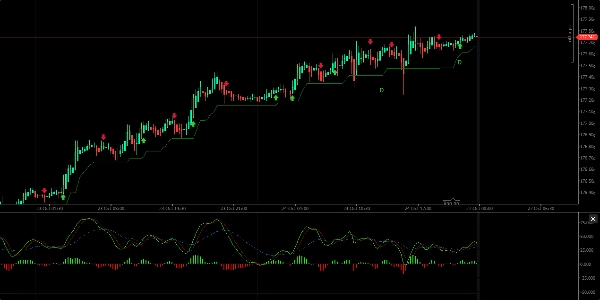
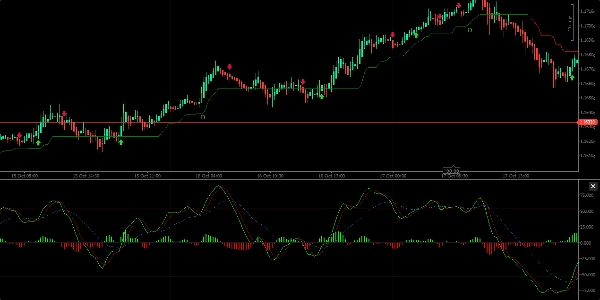
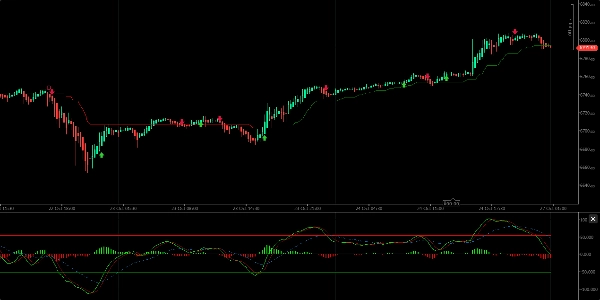
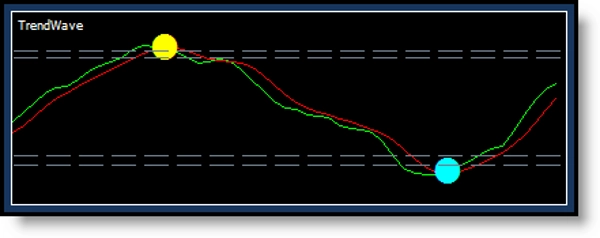
Dostarcza sygnały kupna-sprzedaży, wskazania kierunku trendu oraz identyfikuje strefy wykupienia i wyprzedania. Wizualnie składa się z dwóch linii wartości z chmurą/histogramem pośrodku, który porusza się powyżej i poniżej linii środkowej, reprezentując rosnące lub malejące trendy.
Kluczowe cechy:
- Sygnały kupna pojawiają się, gdy zielona linia przecina czerwoną linię w górę; sygnały sprzedaży, gdy zielona linia przecina w dół.
- Pokazuje kierunek trendu za pomocą fal chmury powyżej lub poniżej linii środkowej.
- Wskaźnik wyświetla zielone (kupno) i czerwone (sprzedaż) kropki na punktach przecięcia, wraz z odpowiadającymi zmianami koloru świec (żółty dla kupna, turkusowy dla sprzedaży).
- Najlepiej używać na interwałach 12-godzinnych lub 1-dniowych, aby uniknąć nadmiernego krótkoterminowego szumu.
- Wskaźnik może identyfikować dywergencje między ceną a momentum (regularne bycze i niedźwiedzie dywergencje), sygnalizując potencjalne odwrócenia cen.
- Zaleca się łączenie WaveTrend z innymi wskaźnikami, takimi jak WMA, CMF, RSI i MACD, dla bardziej wiarygodnych decyzji handlowych.
Ogólnie rzecz biorąc, WaveTrend jest funkcjonalnym narzędziem przydatnym do identyfikacji kierunku trendu i sygnałów handlowych, ale powinien być używany wraz z innymi narzędziami analizy dla potwierdzenia.
Podsumowanie
Profil wskaźnika
Opinie klientów
5.0
Opinie: 2
5 | 100 % | |
4 | 0 % | |
3 | 0 % | |
2 | 0 % | |
1 | 0 % |
Opinie klientów
November 6, 2025
the main upside is the trade idea gets slowed down first. The setup still needs say no.
Dyskusja
Częste pytania
Signal
ZigZag
EURUSD
Supertrend
GBPUSD
RSI
XAUUSD
NAS100
ATR
MACD
Produkty dostępne za pośrednictwem cTrader Store, w tym boty handlowe, wskaźniki i wtyczki, dostarczane są przez deweloperów zewnętrznych i udostępniane wyłącznie w celach informacyjnych oraz w celu zapewnienia dostępu technicznego. cTrader Store nie jest brokerem i nie zapewnia doradztwa inwestycyjnego, nie udziela spersonalizowanych rekomendacji ani nie gwarantuje przyszłych wyników.


Cena
Od 16/03/2025
256
Bezpłatne instalacje