
Opis
Opis:
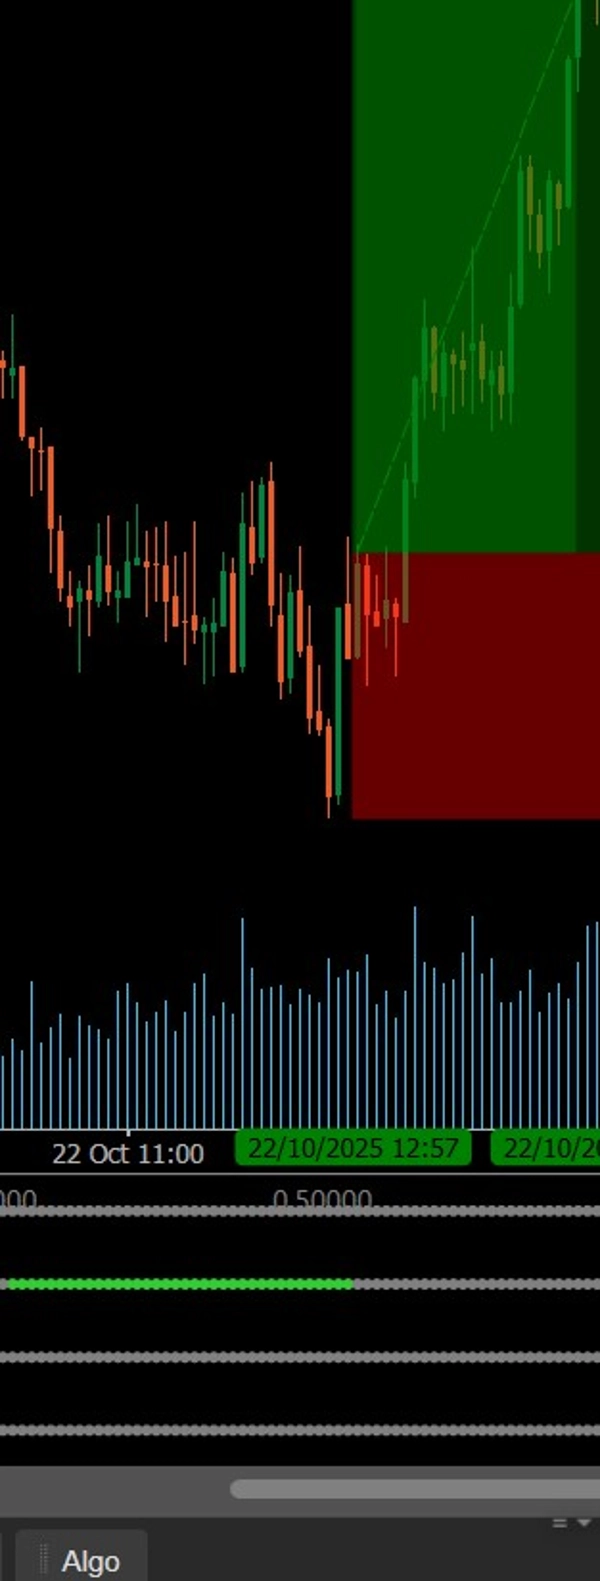
Ten wskaźnik wizualizuje trendy RSI w czterech konfigurowalnych ramach czasowych za pomocą kolorowych kropek (zielone dla wyprzedania, czerwone dla wykupienia, szare dla neutralności). Pomaga traderom natychmiast ocenić zgodność momentum rynku oraz zidentyfikować potwierdzenia RSI na wielu ramach czasowych dla silniejszych wejść.
Podsumowanie
Profil wskaźnika
Opinie klientów
4.0
Opinie: 1
5 | 0 % | |
4 | 100 % | |
3 | 0 % | |
2 | 0 % | |
1 | 0 % |
Opinie klientów
November 8, 2025
A few signals across sessions tell more, and the review screen feels calmer.
Dyskusja
Częste pytania
BTCUSD
Prop
Forex
Scalping
Indices
EURUSD
Commodities
RSI
Crypto
Stocks
XAUUSD
Martingale
Produkty dostępne za pośrednictwem cTrader Store, w tym boty handlowe, wskaźniki i wtyczki, dostarczane są przez deweloperów zewnętrznych i udostępniane wyłącznie w celach informacyjnych oraz w celu zapewnienia dostępu technicznego. cTrader Store nie jest brokerem i nie zapewnia doradztwa inwestycyjnego, nie udziela spersonalizowanych rekomendacji ani nie gwarantuje przyszłych wyników.
Więcej od tego autora


Możesz także polubić


Cena
Od 21/01/2025
3
Sprzedaż