Opis
Mapa ciepła płynności - Profesjonalna analiza pivotów na wielu ramach czasowych
Zmień swoje podejście do handlu dzięki zaawansowanej wizualizacji płynności. Ten potężny wskaźnik ujawnia strefy płynności instytucjonalnej, analizując punkty pivot na 10 różnych ramach czasowych jednocześnie, tworząc dynamiczną mapę ciepła, która pokazuje dokładnie, gdzie prawdopodobnie znajduje się inteligentny kapitał.
Jak to działa
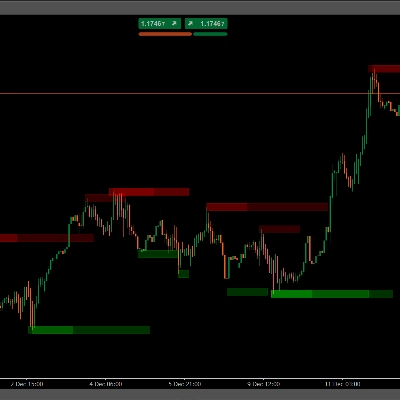
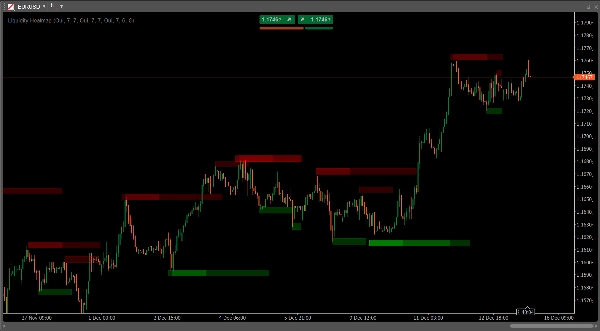
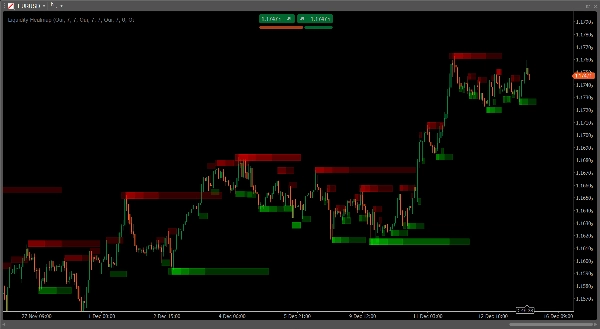
Wskaźnik wykrywa lokalne maksima i minima pivot na wielu ramach czasowych (15min, 30min, 1H, 2H, 4H, Daily, 8H, 3D, Weekly, Monthly) i nakłada półprzezroczyste strefy na każdym poziomie pivot. Tam, gdzie zbiegają się pivoty z różnych ram czasowych, strefy nakładają się i intensyfikują kolor, tworząc "sygnaturę ciepła", która ujawnia najsilniejsze poziomy płynności na Twoim wykresie.
Kluczowe cechy
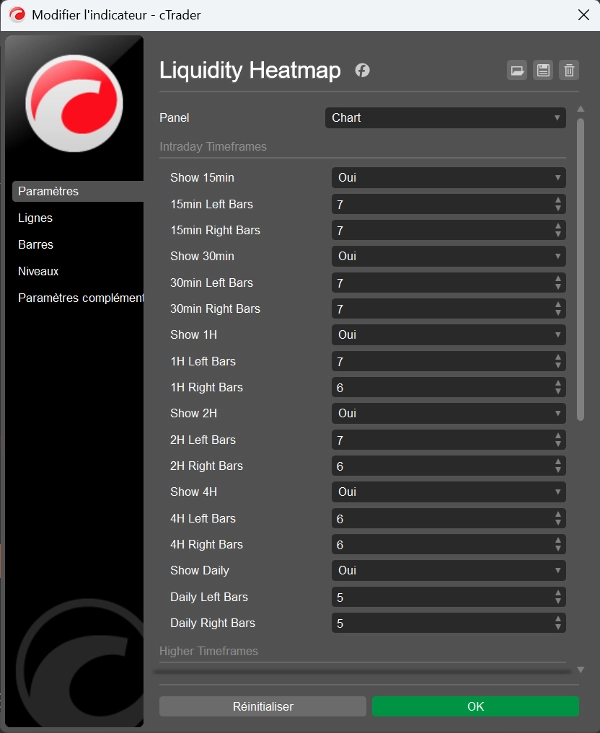
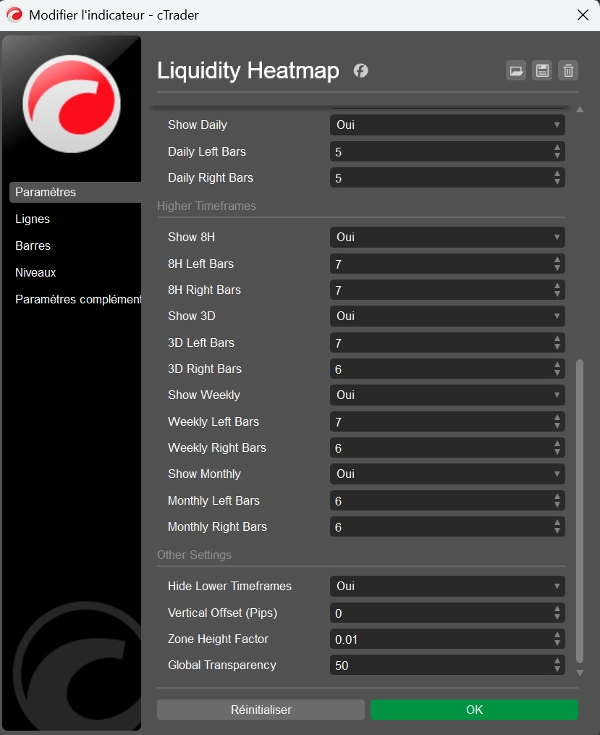
- 10 konfigurowalnych ram czasowych: Analiza od intraday (15min) do długoterminowych (Monthly) perspektyw jednocześnie
- Inteligentne mapowanie gęstości: Nakładające się strefy automatycznie tworzą ciemniejsze obszary pokazujące konfluencję płynności
- W pełni regulowane wykrywanie pivotów: Konfiguracja lewych/prawych słupków (2-20) dla każdej ramy czasowej niezależnie
- Adaptacyjna wizualizacja: Wysokość strefy automatycznie skaluje się wraz z zoomem wykresu dla spójnego wyglądu
- Strefy zakotwiczone w czasie: Strefy pozostają przypisane do dokładnego czasu ich powstania, nigdy nie przesuwając się na wykresie
- Konfigurowalna przezroczystość: Kontrola globalnej przezroczystości (0-255) dostosowana do stylu wykresu
- Inteligentne filtrowanie ram czasowych: Opcja ukrywania niższych ram czasowych w zależności od aktualnego widoku wykresu
- Kontrola przesunięcia pionowego: Precyzyjne dostosowanie położenia strefy za pomocą regulacji w pipach
- Oddzielne kodowanie kolorów: Czerwone strefy dla lokalnych maksimów (opór), zielone dla lokalnych minimów (wsparcie)
Idealne dla
- Traderów Smart Money Concepts (SMC) identyfikujących pule płynności
- Śledzących metodologię ICT poziomy instytucjonalne
- Traderów swingowych szukających stref odwrócenia o wysokim prawdopodobieństwie
- Skalperów identyfikujących intradayowe chwyty płynności
- Każdego tradera szukającego konfluencji na wielu ramach czasowych
Zastosowania handlowe
Mapa ciepła ujawnia, gdzie skupiają się stop lossy i gdzie prawdopodobnie znajdują się zlecenia instytucjonalne. Wykorzystaj te strefy, aby:
- Przewidywać zmiatanie płynności i odwrócenia
- Identyfikować silne konfluencje wsparcia/oporu
- Znajdować optymalne punkty wejścia po chwytach płynności
- Ustawiać strategiczne stop lossy poza kluczowymi strefami płynności
- Potwierdzać ważność wybicia obserwując zużycie płynności
Dlaczego ten wskaźnik wyróżnia się
W przeciwieństwie do podstawowych wskaźników pivot pokazujących poziomy z jednej ramy czasowej, ta mapa ciepła agreguje dane z 10 ram czasowych jednocześnie, dając Ci kompleksowy obraz struktury rynku. Wizualizacja gęstości natychmiast pokazuje, które poziomy mają największe znaczenie - im ciemniejsza strefa, tym więcej ram czasowych zgadza się co do tego poziomu płynności.
Optymalizacja wydajności
Efektywnie przetwarza do 500 słupków na ramę czasową z inteligentnym zarządzaniem obiektami, zapewniając płynne działanie wykresu nawet przy włączonych wszystkich ramach czasowych.
Łatwa konfiguracja
Zainstaluj i zacznij handlować od razu z zoptymalizowanymi ustawieniami domyślnymi lub dostosuj każdy parametr do swojej konkretnej strategii i stylu handlu.
Podnieś swoją analizę płynności i handluj z wiedzą o przepływie zleceń instytucjonalnych. Idealne dla traderów, którzy rozumieją, że cena nie porusza się przypadkowo - porusza się w kierunku płynności.
Podsumowanie
Key features include customizable pivot detection parameters for each timeframe, adaptive zone visualization that scales with chart zoom, and separate color coding for resistance (red) and support (green) zones. The indicator also offers adjustable transparency, vertical offset control, and smart timeframe filtering to hide lower timeframes based on the current chart view.
This tool is suitable for traders using Smart Money Concepts, ICT methodology, swing trading, scalping, or any strategy requiring multi-timeframe liquidity analysis. It helps identify clusters of stop losses and institutional orders to anticipate liquidity sweeps, reversals, strong support/resistance levels, optimal entry points, strategic stop losses, and breakout confirmations.
Liquidity Heatmap efficiently processes up to 500 bars per timeframe with optimized object management, ensuring smooth performance. It supports various markets including Forex, Crypto, Stocks, Indices, and Commodities. The indicator comes with optimized default settings and full customization options to fit different trading styles.
Opinie klientów
5 | 100 % | |
4 | 0 % | |
3 | 0 % | |
2 | 0 % | |
1 | 0 % |


![Logo „[Stellar Strategies] Smart ADX”](https://cdn.ctrader.com/image/webp/af13b084-b6f6-41db-b7bc-c7e688b57b05_36929)

