Opis
Trend SR System to wskaźnik wykresu ukierunkowany na trendy, zaprojektowany, aby pomóc traderom w wyraźniejszym identyfikowaniu kontekstu rynkowego, kluczowej struktury EMA, dynamicznych poziomów wsparcia/oporu oraz potencjalnych stref kontynuacji lub krótkoterminowej rewizji średniej.
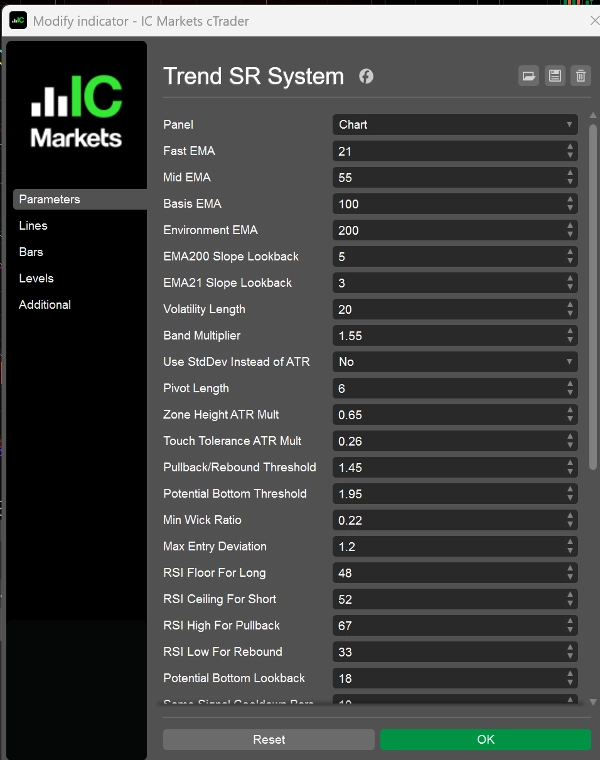
Wskaźnik opiera się na EMA21, EMA55, EMA100 i EMA200:
- EMA200 jest używana jako filtr środowiska rynkowego na wyższym poziomie
- EMA100 działa jako centralna oś cenowa i linia bazowa pasma
- EMA55 pomaga identyfikować średnioterminowy nacisk wsparcia i oporu
- EMA21 służy do śledzenia krótkoterminowego rytmu, cofnięć i korekt
Ponadto wskaźnik łączy pasma zmienności, strefy strukturalne oparte na pivotach oraz logikę dynamicznego wsparcia/oporu w stylu krokowym, aby zapewnić bardziej uporządkowany obraz rynku.
Główne cechy
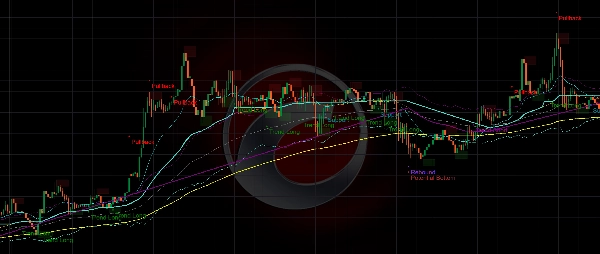
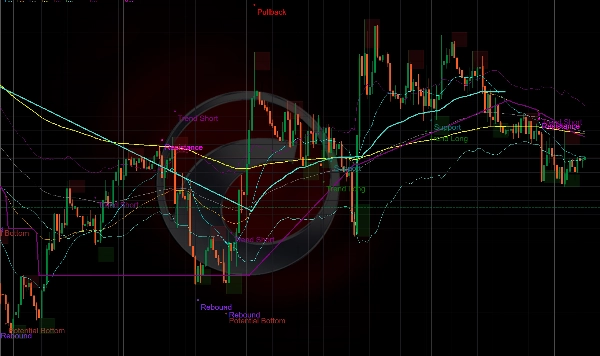
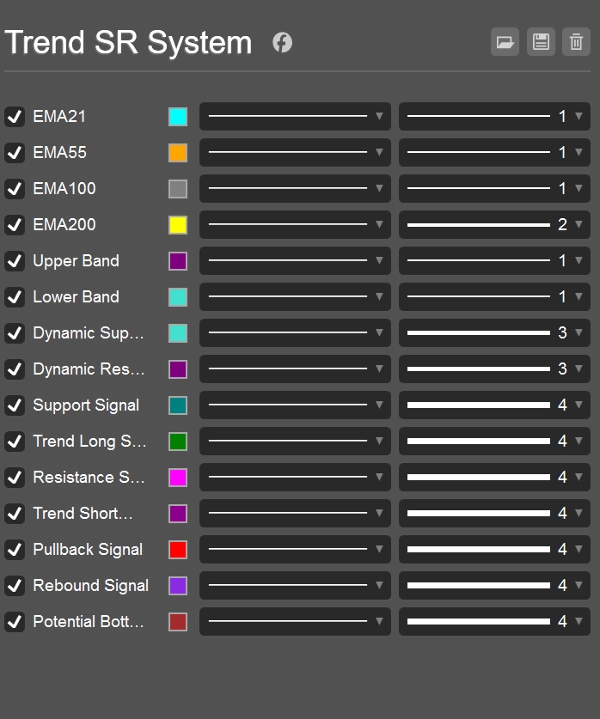
- Wyświetla 4 kluczowe linie struktury EMA
- Pokazuje górne i dolne pasma oparte na ATR lub odchyleniu standardowym
- Generuje dynamiczne poziomy wsparcia i oporu
- Wykrywa strukturalne obszary wsparcia/oporu za pomocą logiki pivotów
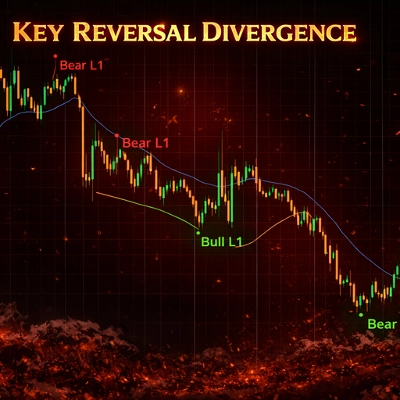
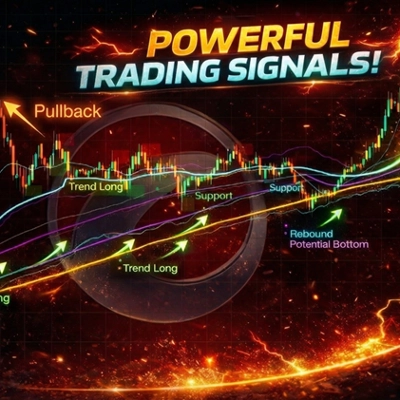
- Dostarcza sygnały typu kontynuacji i krótkoterminowej korekty
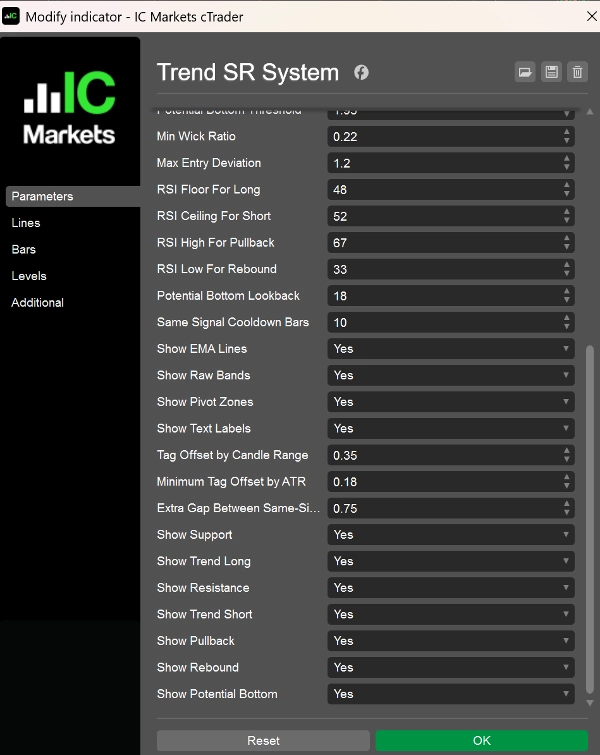
- Pozwala na włączanie lub wyłączanie poszczególnych typów sygnałów
Typy sygnałów
- Wsparcie
Kluczowy obszar wsparcia w środowisku byczym, sugerujący, że cena jest broniona po cofnięciu. - Trend Long
Sygnał długiej pozycji podążający za trendem na rynku byczym, zwykle pojawiający się po wznowieniu impetu wzrostowego po cofnięciu. - Opór
Kluczowy obszar oporu w środowisku niedźwiedzim, sugerujący, że cena jest ograniczana po korekcie. - Trend Short
Sygnał krótkiej pozycji podążający za trendem na rynku niedźwiedzim, zwykle pojawiający się po utracie siły odbicia i wznowieniu trendu spadkowego. - Cofnięcie
Krótkoterminowe ostrzeżenie o nadmiernym rozciągnięciu w środowisku byczym, sugerujące możliwe ryzyko cofnięcia lub konsolidacji. - Odbicie
Krótkoterminowe ostrzeżenie o wyprzedaniu w środowisku niedźwiedzim, sugerujące możliwe ryzyko technicznego odbicia. - Potencjalne dno
Silniejszy sygnał typu odbicia po wyprzedaniu, wskazujący na możliwą próbę utworzenia tymczasowego dna.
Typowe zastosowania
Ten wskaźnik nadaje się do:
- Analizy podążającej za trendem
- Określania momentu wejścia po cofnięciu i korekcie
- Obserwacji struktury EMA oraz wsparcia/oporu
- Monitorowania nadmiernie rozciągniętych warunków byczych lub niedźwiedzich
- Filtrowania transakcji na podstawie wykresu i wspomagania decyzji dyskrecjonalnych
Może być stosowany na rynku forex, indeksach, metalach, kryptowalutach i innych rynkach trendowych.
Najlepszy dla
Ten wskaźnik jest przeznaczony dla traderów, którzy:
- Chcą mieć wyraźniejszy i bardziej uporządkowany widok wykresu
- Skupiają się na kontynuacji trendu i kluczowych strefach reakcji
- Używają struktury EMA wraz z zachowaniem ceny oraz wsparciem/oporem
- Preferują wizualne wsparcie handlu dla ustawień krótkoterminowych i średnioterminowych
Uwagi dotyczące użytkowania
- Najlepiej używać razem z kontekstem rynkowym i solidnym zarządzaniem ryzykiem
- Sygnały nie powinny być traktowane jako samodzielne porady handlowe
- Jakość sygnałów może się pogorszyć podczas zmiennego lub niskowolumenowego rynku
- Jest to narzędzie do analizy wykresów i wsparcia decyzji handlowych, a nie system gwarantujący wyniki
Podsumowanie
Opinie klientów
5 | 0 % | |
4 | 100 % | |
3 | 0 % | |
2 | 0 % | |
1 | 0 % |