คำอธิบาย
TeoriaCutrim เป็นตัวบ่งชี้แบบสถิติที่ออกแบบมาเพื่อวัดพฤติกรรมตลาดล่าสุดผ่านการแจกแจงแท่งเทียนและการวิเคราะห์ความผันผวน แทนที่จะทำนายทิศทาง มันให้ข้อมูลเชิงวัตถุประสงค์เกี่ยวกับสิ่งที่ตลาดเพิ่งทำภายในหน้าต่างแท่งเทียนที่สามารถตั้งค่าได้
ข้อมูลตลาดที่วิเคราะห์
ตัวบ่งชี้จะประเมินจำนวนแท่งเทียนล่าสุดที่ผู้ใช้กำหนด (ช่วงเวลาย้อนหลัง) และดึงข้อมูลดังนี้:
- จำนวนและเปอร์เซ็นต์ของแท่งเทียนขาขึ้น (ปิด > เปิด)
- จำนวนและเปอร์เซ็นต์ของแท่งเทียนขาลง (ปิด < เปิด)
- ความแตกต่างระหว่างความโดดเด่นของแท่งเทียนขาขึ้นและขาลง
- ช่วงแท่งเทียนเฉลี่ย (เป็นพิปส์)
- ช่วงแท่งเทียนปัจจุบัน (เป็นพิปส์)
- ช่วงราคาทั้งหมดในหน้าต่างที่วิเคราะห์
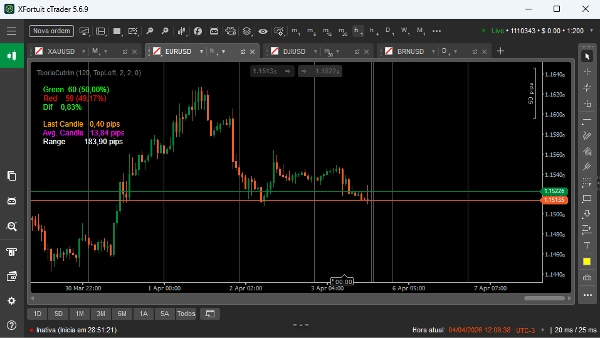
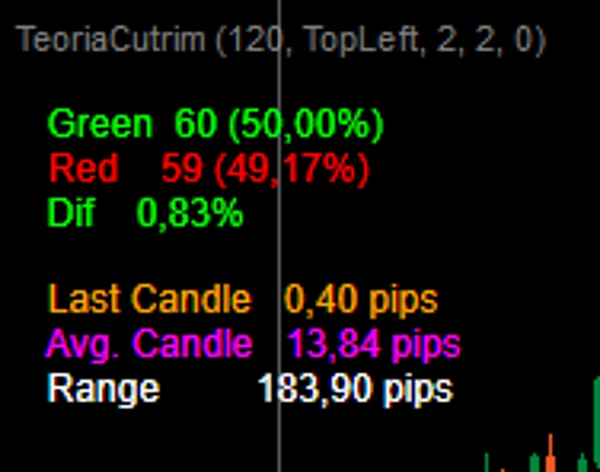
ผลลัพธ์ภาพและการตีความ
ตัวบ่งชี้จะแสดงเมตริกสำคัญโดยตรงบนแผนภูมิ:
- สีเขียว: จำนวนแท่งเทียนขาขึ้นทั้งหมดและเปอร์เซ็นต์
- สีแดง: จำนวนแท่งเทียนขาลงทั้งหมดและเปอร์เซ็นต์
- Dif: ความแตกต่างสัมบูรณ์ระหว่างเปอร์เซ็นต์ของแท่งเทียนขาขึ้นและขาลง
- แท่งเทียนล่าสุด: ขนาดแท่งเทียนปัจจุบันเป็นพิปส์
- แท่งเทียนเฉลี่ย: ขนาดเฉลี่ยของแท่งเทียนในหน้าต่างที่เลือก
- ช่วง: ระยะห่างระหว่างสูงสุดสูงสุดและต่ำสุดต่ำสุดในหน้าต่าง
การตีความเป็นเรื่องง่าย:
- จำนวนแท่งเทียนขาขึ้นที่สูงขึ้นบ่งชี้แรงกดดันขึ้นล่าสุด
- จำนวนแท่งเทียนขาลงที่สูงขึ้นบ่งชี้แรงกดดันลงล่าสุด
- ความแตกต่างต่ำ (Dif) บ่งชี้ความสมดุลหรือความสุ่ม
- ขนาดแท่งเทียนเฉลี่ยที่เพิ่มขึ้นบ่งชี้ความผันผวนที่ขยายตัว
- ช่วงรวมที่ใหญ่บ่งชี้การขยายตัวของตลาด ในขณะที่ช่วงเล็กบ่งชี้การบีบอัด
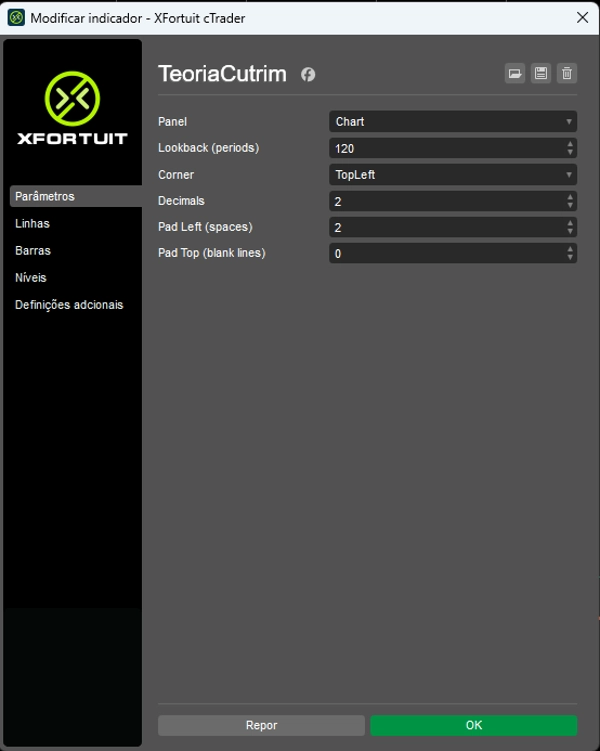
พารามิเตอร์หลัก
- Lookback: จำนวนแท่งเทียนที่ใช้สำหรับการวิเคราะห์ (ปรับได้เต็มที่)
- มุม: ตำแหน่งหน้าจอของการแสดงข้อมูล
- ทศนิยม: จำนวนตำแหน่งทศนิยมที่แสดง
- Pad Left / Pad Top: การปรับระยะห่างทางสายตา
กรณีการใช้งาน
TeoriaCutrim เหมาะสำหรับใช้เป็นเครื่องมือบริบท ไม่ใช่ตัวสร้างสัญญาณ การใช้งานทั่วไปได้แก่:
- การวัดความไม่สมดุลทางสถิติก่อนเข้าทำการซื้อขาย
- การระบุการขยายตัวหรือการหดตัวของความผันผวน
- การกรองการซื้อขายตามพฤติกรรมแท่งเทียนล่าสุด
- สนับสนุนกลยุทธ์เชิงปริมาณหรือเชิงความน่าจะเป็น
กลุ่มเป้าหมายผู้ใช้
ตัวบ่งชี้นี้ออกแบบมาสำหรับเทรดเดอร์ที่พึ่งพาข้อมูล สถิติ และการวิเคราะห์เชิงวัตถุประสงค์ มากกว่าการจดจำรูปแบบเชิงอัตวิสัย เหมาะสำหรับเทรดเดอร์ทั้งแบบมีดุลยพินิจและแบบเป็นระบบ