present
Zarejestruj się i otrzymaj 50 $ zniżki na pierwszy zakup
Trading product for Atrriskvisualizer Wskaźnik Forex Indices, image 1
Atrriskvisualizer
Wskaźnik
Wersja 1.0, Apr 2026
Windows, Mac
4.5
Opinie: 4
Trading product for Atrriskvisualizer Wskaźnik Forex Indices, image 2

Opis

━━━━━━━━━━━━━━━━━━━━━━━━━━━━━━━━━━━━━━━━

ATR Risk Visualizer — Ryzyko

━━━━━━━━━━━━━━━━━━━━━━━━━━━━━━━━━━━━━━━━


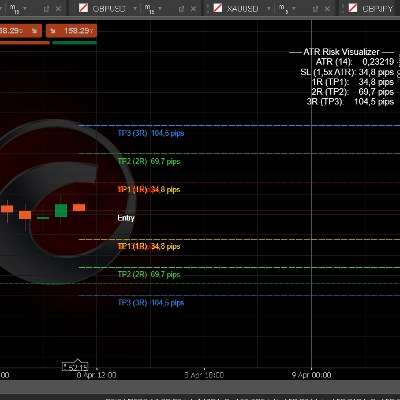
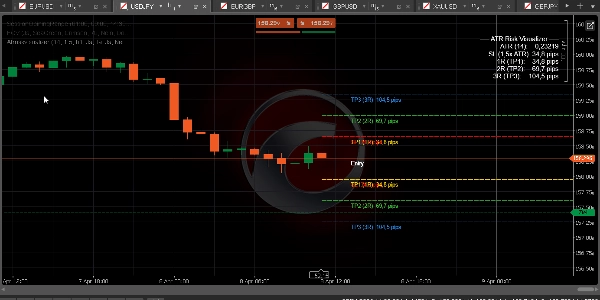
Natychmiast wizualizuje Twoje poziomy Stop Loss i Take Profit oparte na ATR — z pełnym mapowaniem wielokrotności R (1R do 5R) oraz etykietami pipsów — dzięki czemu zawsze handlujesz z określonym ryzykiem przed wejściem w pozycję.


─────────────────────────────

KLUCZOWE CECHY


► Stop Loss oparty na ATR — odległość SL obliczana jako ATR × konfigurowalny mnożnik (domyślnie 1,5×)

► Wielokrotności R Take Profit — TP1 (1R), TP2 (2R), TP3 (3R), TP4 (4R), TP5 (5R) rysowane automatycznie od bieżącej ceny

► Etykiety pipsów na każdym poziomie — zobacz dokładną odległość w pipsach dla SL i każdego TP na pierwszy rzut oka

► Poziomy Long i Short jednocześnie — lub przełącz na tryb tylko Long lub tylko Short

► Selektor interwału czasowego ATR — oblicz ATR z wyższego interwału (np. ATR H1 na wykresie M15)

► Panel informacji ATR (prawy górny róg) — pokazuje wartość ATR, wielkość SL oraz TP1/2/3 w pipsach

► Pełna kontrola kolorów — oddzielne kolory dla SL, TP1, TP2, TP3, TP4/5 za pomocą natywnych selektorów kolorów cTrader

► Konfigurowalny styl linii (ciągła / kreski / kropki) i grubość

► Cena Ask lub Bid jako odniesienie wejścia — wybierz w zależności od kierunku handlu


─────────────────────────────

USTAWIENIA DOMYŚLNE


→ Okres ATR 14

→ Mnożnik ATR 1,5× (SL = 1,5 × ATR)

→ Interwał ATR H1

→ Pokaż TP1/2/3 WŁ.

→ Pokaż TP4/5 WYŁ.

→ Kierunek Oba (Long + Short)

→ Kolor SL Czerwony

→ Kolor TP1 Złoty

→ Kolor TP2 LimeGreen

→ Kolor TP3 DodgerBlue

→ Styl linii Kreski


─────────────────────────────

JAK UŻYWAĆ


1. Dodaj wskaźnik do dowolnego wykresu

2. Ustaw okres ATR i mnożnik zgodnie z Twoją strategią (1,5× ATR to standard dla Forex/Złota)

3. Ustaw interwał ATR na H1 lub H4 dla płynniejszego określania wielkości SL

4. Odczytaj wartości pipsów bezpośrednio z etykiet na wykresie

5. Użyj TP1 (1R) do pierwszej części wyjścia, TP2 (2R) do breakeven, TP3 (3R) do pełnego celu

6. Połącz z wskaźnikami BOS/CHoCH i FVG dla kompletnego workflow wejścia SMC


─────────────────────────────

IDEALNE DLA


✔ Traderów FTMO i firm prop, którzy muszą precyzyjnie określać ryzyko

✔ Traderów SMC i ICT używających wielokrotności R do zarządzania handlem

✔ Traderów Forex, Złota i Indeksów na dowolnym interwale czasowym

✔ Traderów, którzy chcą mieć jasną wizualną mapę ryzyka przed każdym wejściem

✔ Każdego, kto buduje systematyczne podejście do określania wielkości pozycji


─────────────────────────────

KOMPATYBILNOŚĆ


→ Platforma cTrader (Desktop & Web)

→ Klasy aktywów Forex, Indeksy, Surowce, Crypto CFD

→ Interwały Wszystkie (M1 do MN)

→ Uprawnienia Brak wymagań

→ Typ konta Live & Demo


━━━━━━━━━━━━━━━━━━━━━━━━━━━━━━━━━━━━━━━━


Podsumowanie

Profil wskaźnika
Kategoria wskaźnika
Struktura rynku (SMC)
Typ wyjścia
Wizualizacja
Wymagania dotyczące danych
Tylko słupki
Obsługiwane sygnały
Zakres otwarcia sesji
Przebicie poziomu
Zmienność
Przełamanie
Odwrócenie trendu

Opinie klientów

4.5
Opinie: 4
5
50 %
4
50 %
3
0 %
2
0 %
1
0 %
Opinie klientów
April 21, 2026
it helped mostly by making bad ideas easier to skip.
April 19, 2026
ATR Risk Visualizer provides a clear way to map SL and TP levels using ATR and R-multiples. It’s a useful tool for risk planning and trade structuring. However, in its current state, extended TP levels can distort chart scaling, making price action hard to read. With minor visual adjustments, this could become a very strong risk management tool.
April 16, 2026
A 12 trade note set is enough for first impressions. The setup gets a second look.
April 13, 2026
the realistic value is the workflow feels calmer. The trader still needs discipline.

Dyskusja

Częste pytania

Forex
Indices
EURUSD
Commodities
GBPUSD
NZDUSD
Prop
Fair Value Gap
SMC
Crypto
XAUUSD
NAS100
ATR
USDJPY
Produkty dostępne za pośrednictwem cTrader Store, w tym boty handlowe, wskaźniki i wtyczki, dostarczane są przez deweloperów zewnętrznych i udostępniane wyłącznie w celach informacyjnych oraz w celu zapewnienia dostępu technicznego. cTrader Store nie jest brokerem i nie zapewnia doradztwa inwestycyjnego, nie udziela spersonalizowanych rekomendacji ani nie gwarantuje przyszłych wyników.

Więcej od tego autora

Wskaźnik
SMC
Prop
+5
Automatically draws the Opening Range (High & Low) for Tokyo, London, and New York sessions. Configurable start times,
Wskaźnik
Liquidity Grab
Liquidity Sweep
+2
Visualizes accumulation ranges, manipulation sweeps and distribution phases on your cTrader chart.
Wskaźnik
BOS
Key Levels
+2
Maps bullish and bearish order block zones, CE levels and structure-based price action context.
Wskaźnik
MSS
Key Levels
+2
Maps equal highs, equal lows and active liquidity pools directly on your cTrader chart.
Wskaźnik
BOS
MSS
+3
Maps BOS, CHoCH, swing breaks and market structure shifts directly on your cTrader chart.
Wskaźnik
EMA
RSI
+2
Compact premium cTrader dashboard for market bias, sessions, premium/discount context, liquidity direction, ADR range an
cBot
ATR
EMA
+4
Professional Supply & Demand Execution Bot for cTrader. CS Apex Hunter Pro is a fully automated execution bot designed
7.6%
ROI
3.17
Współczynnik zysku
Wskaźnik
SMC
Prop
+12
Killzone, ICT, SMC, Session, Asia, London, New York, NY PM, Session High, Session Low, Smart Money, Order Flow, Trading
Wskaźnik
MSS
Key Levels
+4
Maps session ranges, previous highs/lows, equilibrium and premium/discount zones on your cTrader chart.

Możesz także polubić

Wskaźnik
Forex
BTCUSD
+4
🚀 HALF TREND Indicator - The Ultimate Trend Following System 🚀
Logo „QX TradeDecision”
Najwyżej oceniane
4.5
(4)
$20
/
$22
Wskaźnik
ATR
Flag
+5
Decision panel with Buy/Sell scores, market bias, setup quality, trading cost and clear trade reasons.
Wskaźnik
Prop
Forex
+14
Automatically plots Fibonacci retracement levels using the highest and lowest points of a customizable time range
Wskaźnik
MACD
Prop
+8
NTNPICLL is a tool to check the best trading hours for the assets and also includes the highest and lowest point
Wskaźnik
AI
ATR
+27
Support and Resistance with signals
Wskaźnik
BOS
Key Levels
+1
Guided by Yahuah Yahusha. 15M: BOS above red (buys)/below green (sells). 4HC reject+BOS. 5M: RBS/SBR. SL wick. TP 1:4.
Wskaźnik
Volume
Key Levels
+1
Fixed-grid volume profile: bull and bear volume at every price level, with Point of Control and value area.
Wskaźnik
BOS
Order Block
+3
Not every order block deserves your attention.
Wskaźnik
Forex
BTCUSD
+10
Enhance trading with TSI! Use the True Strength Index for clear insights into market momentum and trend strength.
Wskaźnik
Prop
Forex
+5
Transform your approach to trading with our innovative Pivot Point Indicator.
Wskaźnik
Signal
Breakout
+1
Bolliger Bands + Hamster-Coder™ Timeframe Decoupling
Wskaźnik
AI
BOS
+4
Golden Boom and Crash Spike Detector is a trading tool designed for Crash 300 and Boom 300 indices on M1 Timeframe.
Wskaźnik
ATR
BOS
+5
Know how strong each Supertrend flip is: scored BUY/SELL, structure stop + 3 targets, live win-rate dashboard, alerts.
Wskaźnik
BOS
CHOCH
+5
Smart Money Concepts Automate your institutional analysis and make decisions with pinpoint precision..
Wskaźnik
Prop
VWAP
+5
VWAP is a powerful tool for intraday traders
Wskaźnik
EMA
RSI
+5
Keep your focus with smart on-chart notes. Features Markdown, 6 themes, and auto-save per symbol for manual trading.When
Wskaźnik
RSI
Forex
+12
Indicator pattern signal moment
Wskaźnik
ATR
Forex
+7
Final Moving Average is an adaptive system designed to keep traders aligned with the true direction of the market

Cena

4
Sprzedaż