present
Zarejestruj się i otrzymaj 50 $ zniżki na pierwszy zakup
Trading product for AW Multi Data Wskaźnik, image 1
AW Multi Data
5.62K
Bezpłatne instalacje

Opis

Podsumowanie

Podsumowanie AI
AW Multi Data is a trading indicator that displays key trading metrics directly on your chart. It shows the current symbol and timeframe, daily net profit percentage, daily net profit amount, and spread. The indicator requires the timezone to be set to UTC to accurately reflect daily profit values. This tool provides real-time performance data to assist traders in monitoring their trades within the charting interface.
Profil wskaźnika

Dyskusja

Opinie klientów

0.0
Opinie: 0
Opinie klientów
Ten produkt nie ma jeszcze opinii. Wypróbowałeś(-aś) go już? Bądź pierwszy(-a) i powiedz o tym innym!

Częste pytania

Produkty dostępne za pośrednictwem cTrader Store, w tym boty handlowe, wskaźniki i wtyczki, dostarczane są przez deweloperów zewnętrznych i udostępniane wyłącznie w celach informacyjnych oraz w celu zapewnienia dostępu technicznego. cTrader Store nie jest brokerem i nie zapewnia doradztwa inwestycyjnego, nie udziela spersonalizowanych rekomendacji ani nie gwarantuje przyszłych wyników.

Więcej od tego autora

Logo „IR Candle MTF”
4.6
(6)
Za darmo
with this indicator you could see other time frame candle in your chart.
show spread on chart
some user add moving average to macd to see better. in ctrader 4.3.11 there is a problem with this . I make a macd tha
this indicator show macd on chart.
Multi Time Frame Moving Average is a powerful and flexible indicator for cTrader
 this moving include everything that a trader needs from Moving Average.
this indicaotr show distance between Tenkan to Kijun, Close to Kijun and Close to Tenkan 
Add Slowing to IR Moving Average.
IR Candle Open plots customizable opening price lines for daily, weekly, and monthly candles
Coral indicator
you could put your check list in your chart you could split your test with “,” you could put your checklist in indicat
this indicator show other time frame close in lower time frame. for ex: show daily close in m 15.

Możesz także polubić

All-in-one Pivot Indicator: set Classic, Fibo, Woodie, Camarilla, Demark methods, style levels & labels your way ;)
Configure, simulate, and analyze trading strategies with custom filters, multi-target exits, and detailed performance me
Free SMC on your chart: BOS / CHoCH / MSS structure and fair-value gaps. No repaint, and it measures itself.
Logo „MultiTimeFrameTrend”
4.0
(4)
$19
/
$30
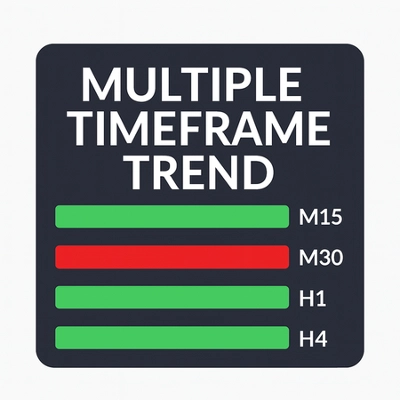
A compact, visual multi-timeframe trend indicator for cTrader. Easily spot bullish or bearish trends across 4 customizab
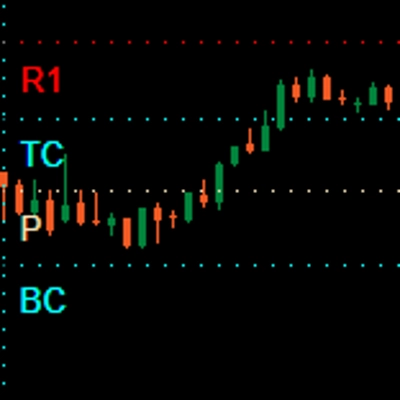
Draws pivots (P, S/R, CPR) from selected anchors like H1–Month1, with optional mid-levels (PS1, S1S2, etc.)
Logo „PivotLevels”
4.7
(4)
$25
/
$30
It draws Pivot Levels on the chart.
Logo „ZigXRay”
4.6
(5)
$29
/
$49
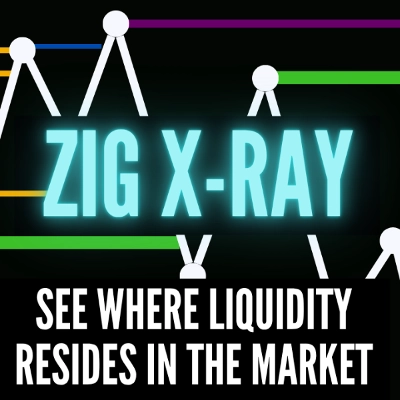
ZigZag Market Structure Identifier - Multi-Layer Scanner: Convergent Pivot Detection, 4-TF Overlay & Naked Chart Mode.
a revolutionary indicator that integrates volume into MACD.
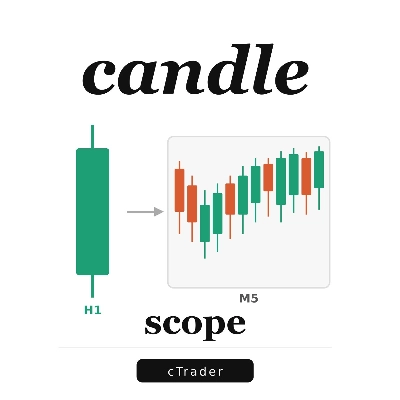
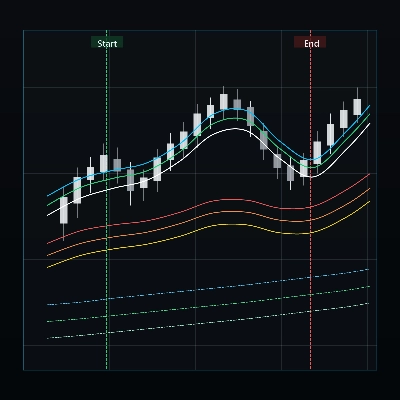
Save time by lighting a candle to look within yourself in another temporality
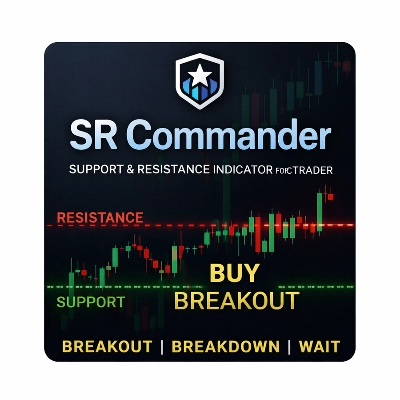
SR Commander is a clean and intelligent support and resistance indicator for cTrader, built to help traders identify key
Multi-timeframe moving averages with session lines for structured trend analysis directly on the chart.
Easy Trade: Trend & Breakout Indicator for cTrader
Map market structure, order blocks, liquidity and key zones with an interactive cTrader dashboard.
Multi-asset screener with real-time RSI/volatility analysis, interactive dashboard, and color-coded trading signals.
The Parabolic SAR, or "Stop and Reverse," is a dynamic technical analysis tool.
The Triple Momentum indicator for cTrader is a versatile trend-following tool.
Logo „ADT_bigCandles”
4.7
(4)
$20
/
$40
Outside Candle Detector: Highlights major candles/zones with ATR filter & pattern labels. By Avydel Talbo, prop trader.
Protect your funded account. Real-time Daily Equity Drawdown monitor with Green / Orange / Red flashing alerts.

Cena

5.62K
Bezpłatne instalacje