MAMA CANDLES
Wskaźnik
Wersja 1.0, Sep 2024
Windows, Mac
4.5
Opinie: 2
Opis
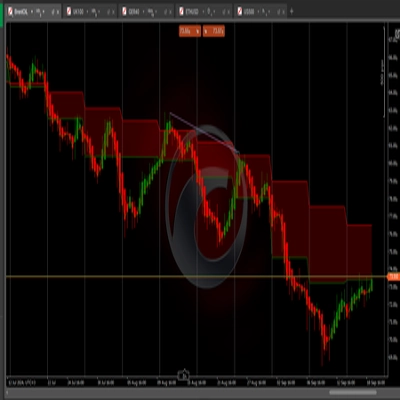
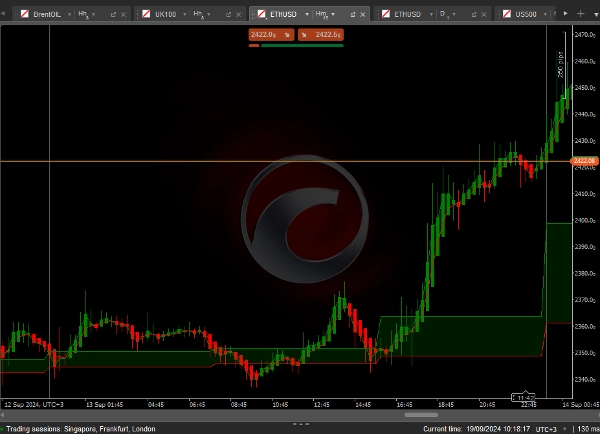
Ten kod implementuje wskaźnik MESA Adaptive Moving Average (MAMA) indykator, złożony filtr adaptacyjny zaprojektowany do reagowania na cykle i wygładzania danych cenowych. Oto przegląd jego kluczowych cech:
Kluczowe elementy:
- Transformata Hilberta: Wskaźnik wykorzystuje transformację Hilberta do obliczenia dominującej fazy cyklu i okresu serii cenowej, co pomaga w identyfikacji cyklu rynkowego.
- Adaptacyjne MAMA i FAMA:
-
- MAMA to szybsza średnia krocząca, która dostosowuje się do dominującego cyklu.
- FAMA to gładsza, wolniejsza średnia.
- Obie są wykreślane na wykresie przy użyciu różnych kolorów.
- Niestandardowe kolorowanie świec:
-
- Świece są kolorowane na zielono, gdy MAMA jest powyżej FAMA (warunek byczy).
- Są kolorowane na czerwono, gdy MAMA jest poniżej FAMA (warunek niedźwiedzi).
Podsumowanie
Profil wskaźnika
Opinie klientów
4.5
Opinie: 2
5 | 50 % | |
4 | 50 % | |
3 | 0 % | |
2 | 0 % | |
1 | 0 % |
Dyskusja
Częste pytania
Produkty dostępne za pośrednictwem cTrader Store, w tym boty handlowe, wskaźniki i wtyczki, dostarczane są przez deweloperów zewnętrznych i udostępniane wyłącznie w celach informacyjnych oraz w celu zapewnienia dostępu technicznego. cTrader Store nie jest brokerem i nie zapewnia doradztwa inwestycyjnego, nie udziela spersonalizowanych rekomendacji ani nie gwarantuje przyszłych wyników.
Więcej od tego autora


Cena
Od 19/09/2024
314.61K
Wolumen transakcji
258.47K
Zysk w pipsach
536
Bezpłatne instalacje