
Penerangan
## 📊 Apakah Squeeze Momentum Pro?
Squeeze Momentum Pro adalah penunjuk momentum dan volatiliti profesional berdasarkan strategi squeeze terkenal yang dipopularkan oleh John Carter. Ia mengenal pasti tempoh pemampatan pasaran (squeeze) dan menjangka pergerakan pecahan yang meletup sebelum ia berlaku.
Penunjuk ini menggabungkan dua alat pengukuran volatiliti yang kuat:
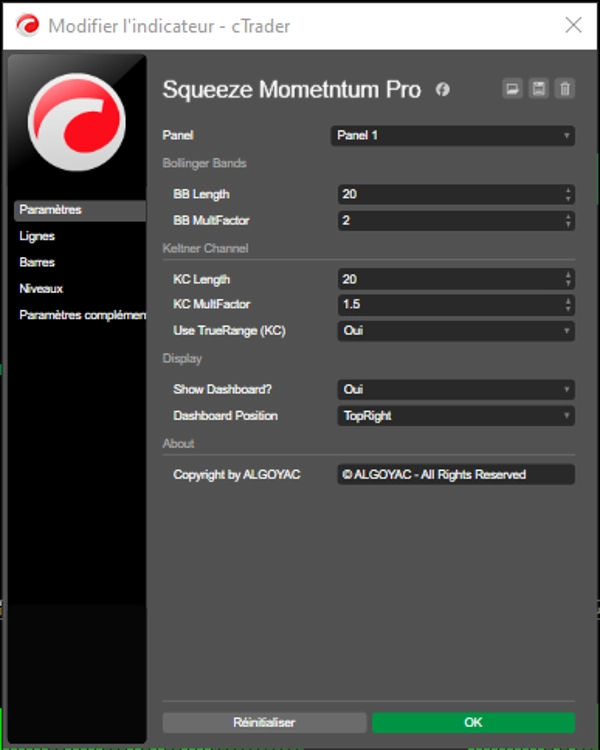
- **Bollinger Bands** (tempoh 20, sisihan piawai 2.0)
- **Keltner Channels** (tempoh 20, gandaan ATR 1.5)
Apabila Bollinger Bands mengecut di dalam Keltner Channels, "squeeze" dikesan, menandakan bahawa pasaran sedang membina tenaga untuk pergerakan meletup yang berpotensi.
## 🎯 Ciri Utama
### 1. Sistem Pengesanan Squeeze
- **Titik Hitam** = Squeeze Aktif (pasaran sedang memampatkan, bersedia untuk pecahan)
- **Titik Biru** = Squeeze Dilepaskan (pecahan sedang berlaku, perhatikan arah momentum)
- **Titik Kelabu** = Tiada Squeeze (keadaan pasaran normal)
### 2. Histogram Momentum
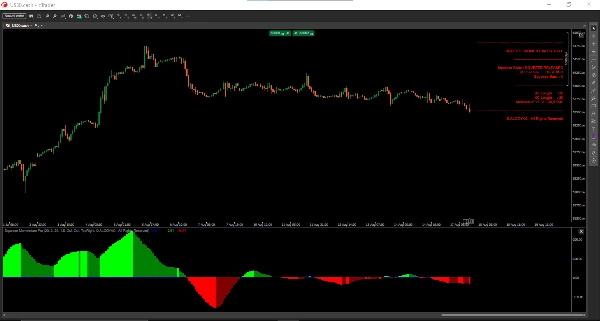
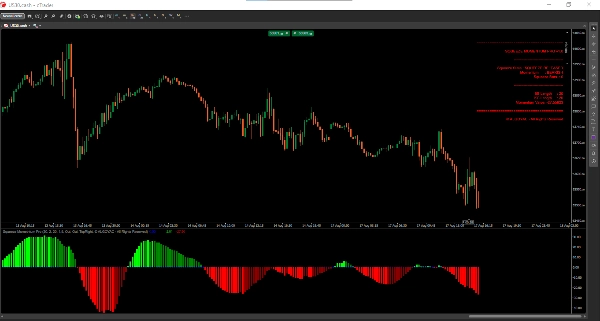
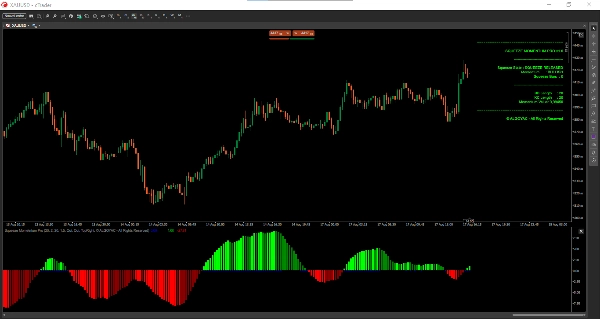
Histogram memaparkan momentum pasaran dengan 4 warna berbeza:
- **Hijau Limau** = Momentum bullish kuat (meningkat)
- **Hijau Gelap** = Momentum bullish lemah (menurun)
- **Merah** = Momentum bearish kuat (menurun)
- **Maroon** = Momentum bearish lemah (meningkat)
### 3. Papan Pemuka Masa Nyata
Papan pemuka terbina dalam memaparkan:
- Keadaan squeeze semasa
- Arah momentum
- Bilangan bar dalam squeeze
- Parameter aktif
## 📈 Cara Mentafsir Isyarat
### Pecahan Squeeze + Momentum
Apabila histogram berubah dari merah ke hijau limau semasa keluar dari squeeze (titik hitam), ini mewakili isyarat bullish yang kuat.
### Tempoh Squeeze
Tempoh squeeze yang lebih lama sering membawa kepada pecahan yang lebih kuat. Papan pemuka memaparkan bilangan bar dalam squeeze untuk membantu mengukur potensi volatiliti.
### Peralihan Warna Momentum
- **Merah → Maroon** : Tekanan jualan berkurang, potensi pembalikan
- **Limau → Hijau** : Tekanan pembelian berkurang, potensi pembalikan
- **Maroon → Limau** : Pembalikan bullish kuat
- **Hijau → Merah** : Pembalikan bearish kuat
## ⚙️ Tetapan & Parameter
### Kumpulan Bollinger Bands
- **BB Length** (lalai: 20) : Tempoh untuk pengiraan Bollinger Bands
- **BB MultFactor** (lalai: 2.0) : Gandaan sisihan piawai
### Kumpulan Keltner Channel
- **KC Length** (lalai: 20) : Tempoh untuk pengiraan Keltner Channel
- **KC MultFactor** (lalai: 1.5) : Gandaan ATR
- **Use TrueRange** (lalai: true) : Tukar antara True Range dan julat High-Low
### Kumpulan Paparan
- **Show Dashboard** (lalai: true) : Paparkan panel maklumat masa nyata
- **Dashboard Position** : Pilih dari 4 posisi
## 💼 Kes Penggunaan Tipikal
### Scalping
- Gunakan pada jangka masa M1-M5
- Masuk apabila squeeze dilepaskan dengan pengesahan momentum
- Keluar apabila warna momentum berubah
### Perdagangan Harian
- Gunakan pada jangka masa M15-H1
- Gabungkan dengan tahap sokongan/rintangan
- Masuk pada tarikan balik pertama selepas pelepasan squeeze
### Perdagangan Swing
- Gunakan pada jangka masa H4-D1
- Cari squeeze berbilang bar
- Masuk pada peralihan warna momentum dari merah ke limau (atau sebaliknya)
## 👥 Siapa Penunjuk Ini Untuk?
### Sesuai untuk:
- **Pedagang breakout** : Kenal pasti momentum sebelum pecahan
- **Pedagang volatiliti** : Ukur fasa pemampatan pasaran
- **Pedagang momentum** : Ikuti kekuatan trend dan pembalikan
- **Dari Pemula ke Lanjutan** : Antara muka intuitif dengan ciri profesional
### Tahap Pengalaman:
- **Pemula** : Mulakan dengan tetapan lalai, gunakan papan pemuka untuk panduan
- **Pertengahan** : Laraskan parameter untuk pasaran tertentu
- **Lanjutan** : Gabungkan dengan tindakan harga dan pelbagai jangka masa
## ⚠️ Nota Penting & Had
1. **Pecahan Palsu** : Tidak semua squeeze menghasilkan pecahan kuat. Sentiasa gunakan pengesahan tambahan.
2. **Keadaan Pasaran** : Berfungsi terbaik dalam pasaran trending. Mungkin memberi isyarat palsu dalam pasaran yang bergerak mendatar.
3. **Sensitiviti Parameter** : Tetapan lalai sesuai untuk kebanyakan pasaran tetapi mungkin perlu disesuaikan untuk instrumen tertentu.
4. **Bukan Sistem Berdiri Sendiri** : Terbaik digunakan bersama alat analisis teknikal lain untuk pengesahan.
5. **Prestasi Masa Lalu** : Isyarat sejarah tidak menjamin keputusan masa depan.
## 🔧 Tetapan Disyorkan Mengikut Pasaran
| Pasaran | BB Length | KC Length | Jangka Masa |
|--------|-----------|-----------|-----------|
| Forex | 20 | 20 | H1-H4 |
| Saham | 20 | 20 | D1 |
| Crypto | 30 | 30 | H1-H4 |
| Indeks| 25 | 25 | M15-H1 |
## 🚀 Memulakan
1. Tambahkan penunjuk ke carta anda
2. Kekalkan tetapan lalai pada mulanya
3. Perhatikan titik hitam (squeeze terbentuk)
4. Tunggu pelepasan squeeze (titik biru)
5. Sahkan dengan warna momentum (limau untuk beli, merah untuk jual)
6. Gunakan papan pemuka untuk rujukan cepat
Ringkasan
Key features include a squeeze detection system with color-coded dots (black for active squeeze, blue for squeeze release, gray for no squeeze), and a momentum histogram displaying four colors to represent bullish and bearish momentum strength and direction. A real-time dashboard provides current squeeze status, momentum direction, squeeze duration, and active parameters.
The indicator supports multiple trading styles and timeframes: scalping (M1-M5), day trading (M15-H1), and swing trading (H4-D1). It is suitable for breakout, volatility, and momentum traders across markets such as Forex, stocks, crypto, and indices, with recommended parameter settings for each.
Users interpret signals by monitoring squeeze states and momentum color transitions to identify potential entries and exits. Adjustable settings allow customization of Bollinger Bands and Keltner Channel parameters, as well as dashboard display options. The indicator is designed for use alongside other technical analysis tools to confirm signals.
Ulasan pelanggan
5 | 50 % | |
4 | 50 % | |
3 | 0 % | |
2 | 0 % | |
1 | 0 % |